City Dashboard: Gun Homicide
Last Updated: 12.18.2023
Learn More:
Summary
In 2022, an estimated 16,800 people died by gun homicide across the US.1Federal Bureau of Investigation, UCR Summary of Crime in the Nation, 2022. (Washington, DC, 2023), https://cde.ucr.cjis.gov/LATEST/webapp/#/pages/home. This report provides trends on “fatal shootings,” which include murders and non-negligent manslaughters involving a firearm. This number—while still unacceptably high—represents a 5.7 percent rate decrease from 2021, and brings the country back to pre-pandemic trends.2While the FBI only began calculating national estimates for fatal shootings in 2021, they estimated an overall murder rate of 6.5 deaths per 100,000 people in 2019 and an overall murder rate of 6.3 per 100,000 people in 2022. Federal Bureau of Investigation, Crime Data Explorer, Trend of Homicide from 2012 to 2022. (Washington, DC, 2023), https://cde.ucr.cjis.gov/LATEST/webapp/#/pages/explorer/crime/crime-trend.
But not everyone felt these declines equally. From 2021 to 2022, gun homicide rates dropped 7.8 percent among adults, but rose 11.1 percent in children and teens.3Federal Bureau of Investigation, UCR Summary of Crime in the Nation, 2022. (Washington, DC, 2023), https://cde.ucr.cjis.gov/LATEST/webapp/#/pages/home. This report uses the term “juveniles” in place of “children and teens,” and includes anyone less than 18 years old. In 2022, Black Americans died by gun homicides at a rate 9.9 times higher than white Americans, and Native American peoples’ rate was 1.45 times higher than white Americans.4 Federal Bureau of Investigation, Table 21: National Fatal Gun Violence — Year-Over-Year trend: Rate Per 100,000 Inhabitants. (Washington, DC, 2023), https://cde.ucr.cjis.gov/LATEST/webapp/#/pages/home. And as always, gun homicides continued to cluster in America’s cities.
The FBI is the leading source of city gun violence data across the country, covering over 94 percent of the US population in 2022.5Federal Bureau of Investigation, UCR Summary of Crime in the Nation, 2022. (Washington, DC, 2023), https://cde.ucr.cjis.gov/LATEST/webapp/#/pages/home. Everytown’s City Gun Homicide dashboard allows users to explore gun homicide trends across over 500 cities with populations of 65,000+ that reported data to the FBI from 2018 to 2022.
Key Takeaways
Across FBI-reporting cities with populations 65,000+:
- Contrary to public perception,1Jeffery M. Jones, “More Americans See U.S. Crime Problem as Serious,” Gallup, November 16, 2023, https://news.gallup.com/poll/544442/americans-crime-problem-serious.aspx?utm_source=substack&utm_medium=email. most cities (69 percent) had below-average gun homicide rates.2The average rate of gun homicides was 6.2 deaths per 100,000 people. This average was calculated by dividing each city’s rate by the total number of cities in the sample to reflect trends across cities with minimal skew.
- Gun homicide rates were notably low—three or fewer deaths per 100,000 people—in three large cities: San Diego, CA; San Jose, CA; and New York, NY.3Gun homicide victims per 100,000 residents were as follows: San Diego, CA was 1.9; San Jose, CA was 2.2; and New York, NY was 3.1.
- Gun homicide rates decreased the most in Trenton, NJ, Wilmington, DE; and New Haven, CT in 2022 relative to the year prior.4Gun homicide rate percent decreases from 2021 to 2022 were as follows: Trenton, NJ decreased 55%, Wilmington, DE decreased 53%, and New Haven, CT decreased 48%.
- Not every city uniformly experienced these low trends. Half of the gun homicides in this sample occurred in just 20 cities, including Chicago, Philadelphia, Houston, Los Angeles, Detroit, and others.5The complete list of 20 cities that comprise 50% of gun homicides in this sample is: Chicago, IL; Philadelphia, PA; Houston, TX; Los Angeles, CA; Detroit, MI; New York, NY; Memphis, TN; Baltimore, MD; Phoenix, AZ; Milwaukee, WI; St Louis, MO; Indianapolis, ID; Dallas, TX; Washington, DC; Atlanta, GA; San Antonio, TX; Kansas City, MO; Louisville, KY; Birmingham, AL; Cleveland, OH. Collectively these cities had a total population of 30,115,064.
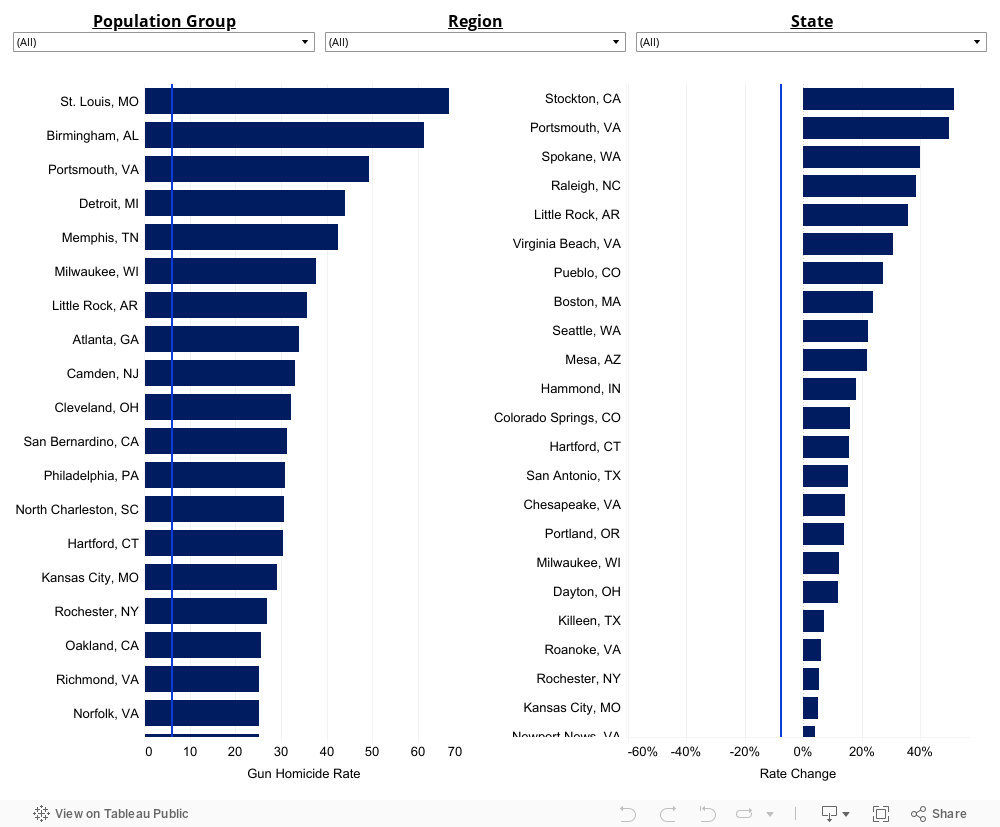
- Gun homicide rates were 42 times worse in cities with the highest gun violence rates compared to those with the lowest rates.6Based on the results of a quartile analysis. Five cities in particular—St. Louis, MO; Birmingham, AL; Portsmouth, VA; Detroit, MI; and Memphis, TN—had alarming rates of 40+ deaths per 100,000 people in 2022.7Gun homicide victims per 100,000 residents were as follows: St. Louis was 66.7, MO; Birmingham, AL was 61.3; Portsmouth, VA was 49.3; Detroit, MI was 44.0, and Memphis, TN was 42.4.
- From 2019 through 2022, three cities consistently ranked amongst the worst gun homicide rates: Detroit, MI; Memphis, TN, and St. Louis, MO. Two new cities—Milwaukee, WI and Little Rock, AR—joined this group, and one city—Wilmington, DE—dropped out after experiencing notable declines.82022 gun homicide victims per 100,000 residents were as follows: Detroit, MI was 44.0; Memphis, TN was 42.4; St. Louis, MO was 66.7; Milwaukee, WI was 37.7; Little Rock, AR was 35.7; and Wilmington, DE was 24.0.
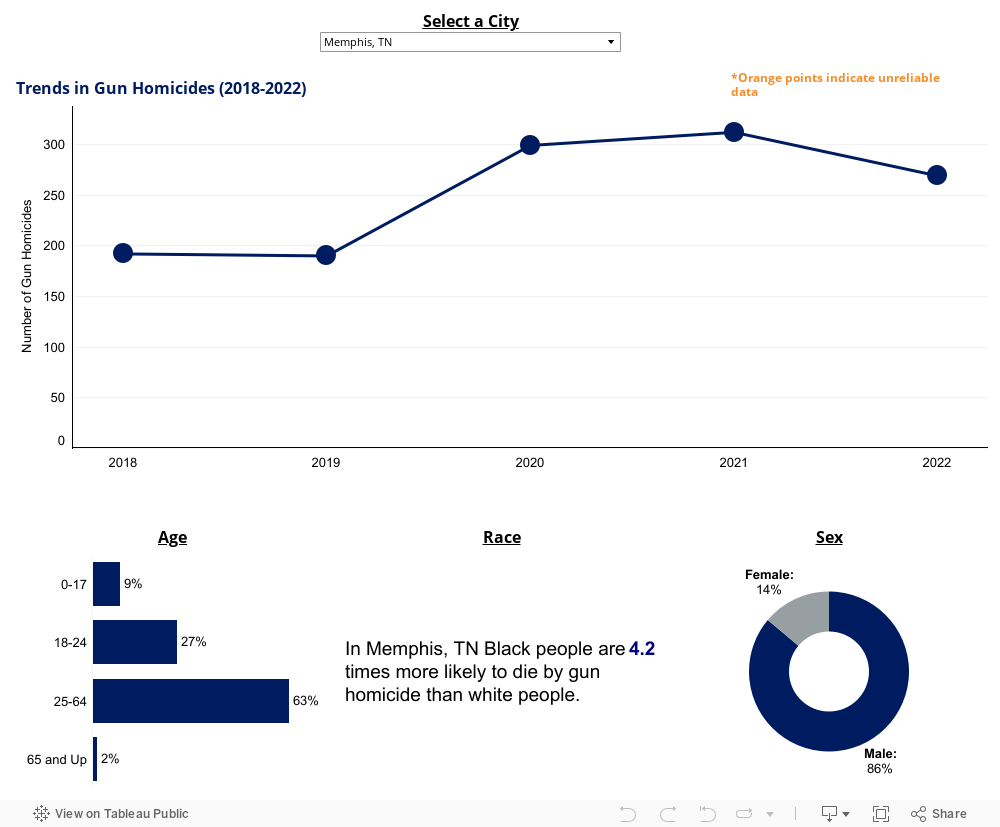
Gun Homicide Trends by City
Compare Gun Homicide Across Cities
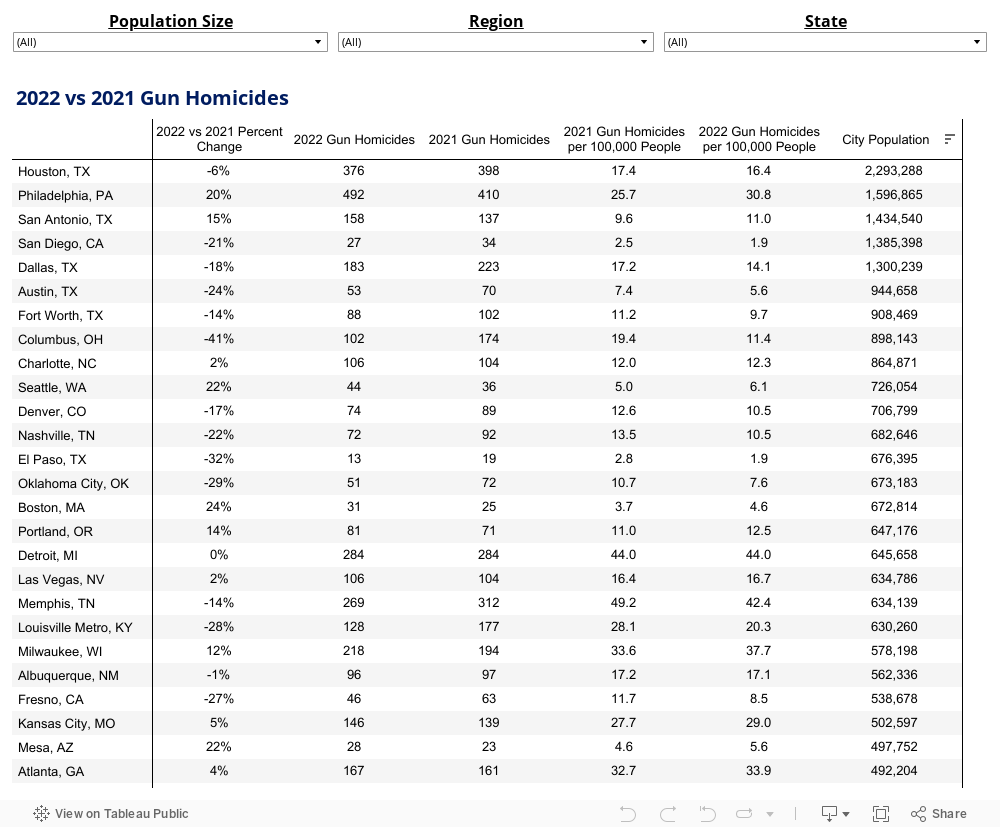
Data Tables: Gun Homicide
Methodology and Sources
The FBI defines gun homicides as “murders, non-negligent manslaughters, killings of felons by law enforcement officers or private citizens, and negligent manslaughters.” Gun homicide data featured in this dashboard is drawn from the FBI’s annually released Supplementary Homicide Report (SHR). Researchers consulted the FBI’s newer data system, National Incident-Based Reporting System (NIBRS), in developing this tool, but ultimately relied on SHR data, as it was more complete both within and across cities. Data was flagged as unreliable when FBI data notably differed from data reported directly by local law enforcement agencies.
All cities with populations of at least 65,000 and a local law enforcement agency that reported twelve months of data per year were included. Across the country, city definitions and geographic boundaries lack clarity and are often conflated with counties, metropolitan statistical areas, and more localized communities within them. This dashboard uses Census places to define city boundaries and populations and allocate law enforcement agencies. For county-level data, please see EveryStat.
Rates and percent changes are only calculated for cities with firearm homicide counts of 10 people and above. Averages are calculated based on the selected and displayed cities. Victim characteristic graphics are calculated using FBI five year totals, and due to rounding, graphs may not add to 100 percent. If five years of data were not available for a city, the values were calculated using all available data. Visualizations with year-over-year changes only display cities that reported complete data in both the current and prior year. Cities that reported unreliable data for either 2021 or 2022 are also excluded from the rate change analysis.
Sources:
- FBI Supplementary Homicide Report, 2016-2022 (accessed December 2023) https://cde.ucr.cjis.gov/LATEST/webapp/#/pages/downloads
- FBI National Incident Based Reporting System 2021-2022 (accessed October 2023) https://cde.ucr.cjis.gov/LATEST/webapp/#/pages/downloads
- American Community Survey 2016 to 2022 (accessed October 2023) https://www.census.gov/programs-surveys/acs
Everytown Research & Policy is a program of Everytown for Gun Safety Support Fund, an independent, non-partisan organization dedicated to understanding and reducing gun violence. Everytown Research & Policy works to do so by conducting methodologically rigorous research, supporting evidence-based policies, and communicating this knowledge to the American public.