Information From Past Pandemics, And What We Can Learn: A Literature Review
In both the 1918 influenza and the 2003 SARS outbreaks, economic activity fell sharply during the epidemic but snapped back once it ended.

In both the 1918 influenza and the 2003 SARS outbreaks, economic activity fell sharply during the epidemic but snapped back once it ended.
The United States has officially entered a bear market, with major financial indices falling by more than 20% since the beginning of the year. The market has fallen in response to a mix of information, including global community spread of the Novel Coronavirus COVID-19, a travel ban for Europeans into the US, and general uncertainty about a fiscal response to the virus.
Zillow Research conducted a deep dive into past research and data on the economic effects of global pandemics to help provide perspective on what the future could hold under various scenarios. We found the following main quantitative patterns:
Empirical research into the SARS and 1918 influenza pandemics both indicate a significant loss in output during the time of the pandemic. Hong Kong lost 5.1% of monthly output during the 5 months of the SARS epidemic (or 1.75% of annualized GDP) and the US lost between 7% and 9.5% of monthly industrial production during the 1918 influenza epidemic, with an effect on annual GDP of 0.5%. The effects vary by sector–the epidemics led to people curtailing unnecessary social activities and curtailing human contact, which led to larger falls in services and (semi-)durable goods, while the effect on manufacturing is influenced by trade spillovers.
Since consumers wish to avoid nonessential human contact, the 2003 SARS pandemic led to a temporary fall in monthly real estate transactions from 33% to 72% vs. baseline for the duration of the epidemic, while real estate prices held steady.
Meanwhile, during the current episode in China, news reports and early data provided by Goldman Sachs (2020) indicate a near-shutdown in the volume of Chinese real estate transactions, although there is not yet a clear effect on real estate prices.
| Author(s) | Scenario | Data/model | Main findings |
|---|---|---|---|
| Zillow Economic Research (2020) | Hong Kong, SARS, 2003 | Aggregated macro data | 1.75% loss in annualized GDP, or 5.1% monthly loss at peak. Quick recovery to trend after end of pandemic. 1.3% increase in unemployment; unemployment recovered within 3 quarters. Statistically insignificant 1.9% fall in home prices, count of transactions down by an average of 33% for duration of pandemic. |
| Lee and McKibbin (2012) | Multiple countries, SARS, 2003 | Theoretical model | 2.63% loss in annualized GDP for Hong Kong, 1.05% loss for China. Size of loss depends on policy response. |
| Wong (2008) | Hong Kong, SARS, 2003 | Micro data on 44 housing estates | 1.6% fall in home value, 2.8% in infected areas. 72% fall in transactions volume. |
| Siu and Wong (2004) | Hong Kong, SARS, 2003 | Disaggregated macro data | Shift to at-home consumption, away from travel, restaurants, and entertainment. Trade was mainly unaffected. |
| James and Sargent (2006, 2006a) | Canada and US mild flu pandemic | Aggregated macro data | Loss of Canadian industrial production of 1.2% at peak of epidemic (Oct 1957). 0.3% to 1.1% of annualized GDP. Coincided with a recession. |
| CBO (2006) | US, mild flu pandemic | Theoretical model | 1% loss of annualized GDP. |
| Keogh-Brown et al. (2010) | UK, mild flu pandemic | Theoretical model | 0.6%-2.5% loss of annualized GDP, depending on how customers shift their consumption behavior. |
| James and Sargent (2006) | US, severe flu pandemic | Aggregated macro data | 1918 flu saw annual GDP impact of 0.5%, with loss of 7% of monthly industrial production at peak (Oct 1918). Coincided with drawdown surrounding end of World War I and a recession. |
| CBO (2006) | US, severe flu pandemic | Theoretical model | 4.25% loss of annualized GDP. |
| McKibbin and Sidorenko (2006, 2006a) | US, severe flu pandemic | Theoretical model | 5.5% loss of annualized GDP. |
| Cooper (2006) | US, severe flu pandemic + trade disruption | Theoretical model | 6% loss of annualized GDP, of which 1.75% is due to trade disruption. |
| Zillow Economic Research (2020) | US, severe flu pandemic, 1918 | Aggregated macro data | 9.5% loss in industrial production in October 1918 (peak of epidemic) vs. July 1918, but less reliable data on other sectors. |
| Kennedy, Thompson, and Vujanovic (2006) | Australia, severe flu pandemic | Theoretical model | 6% loss of annualized GDP. |
| Douglas, Szeto, and Buckle (2006) | New Zealand, severe flu pandemic | Theoretical model | 5-10% loss of annualized GDP. |
| Keogh-Brown et al. (2010) | UK, severe flu pandemic | Theoretical model | 4.5%-6% loss of annualized GDP, depending on how customers shift their consumption behavior. |
The SARS epidemic began in the Guangdong province of China in November 2002. In February 2003, the first confirmed cases appeared in Hong Kong. The epidemic peaked in March and April 2003 and trailed off during May and June, until Hong Kong was removed from the WHO’s list of affected areas on June 23.
The chart below shows how real GDP and unemployment evolved before, during, and after the SARS epidemic. GDP data are shown as a percent relative to a Q4 2001 baseline. Both datasets are obtained from the Hong Kong Monthly Digest of Statistics, various issues.
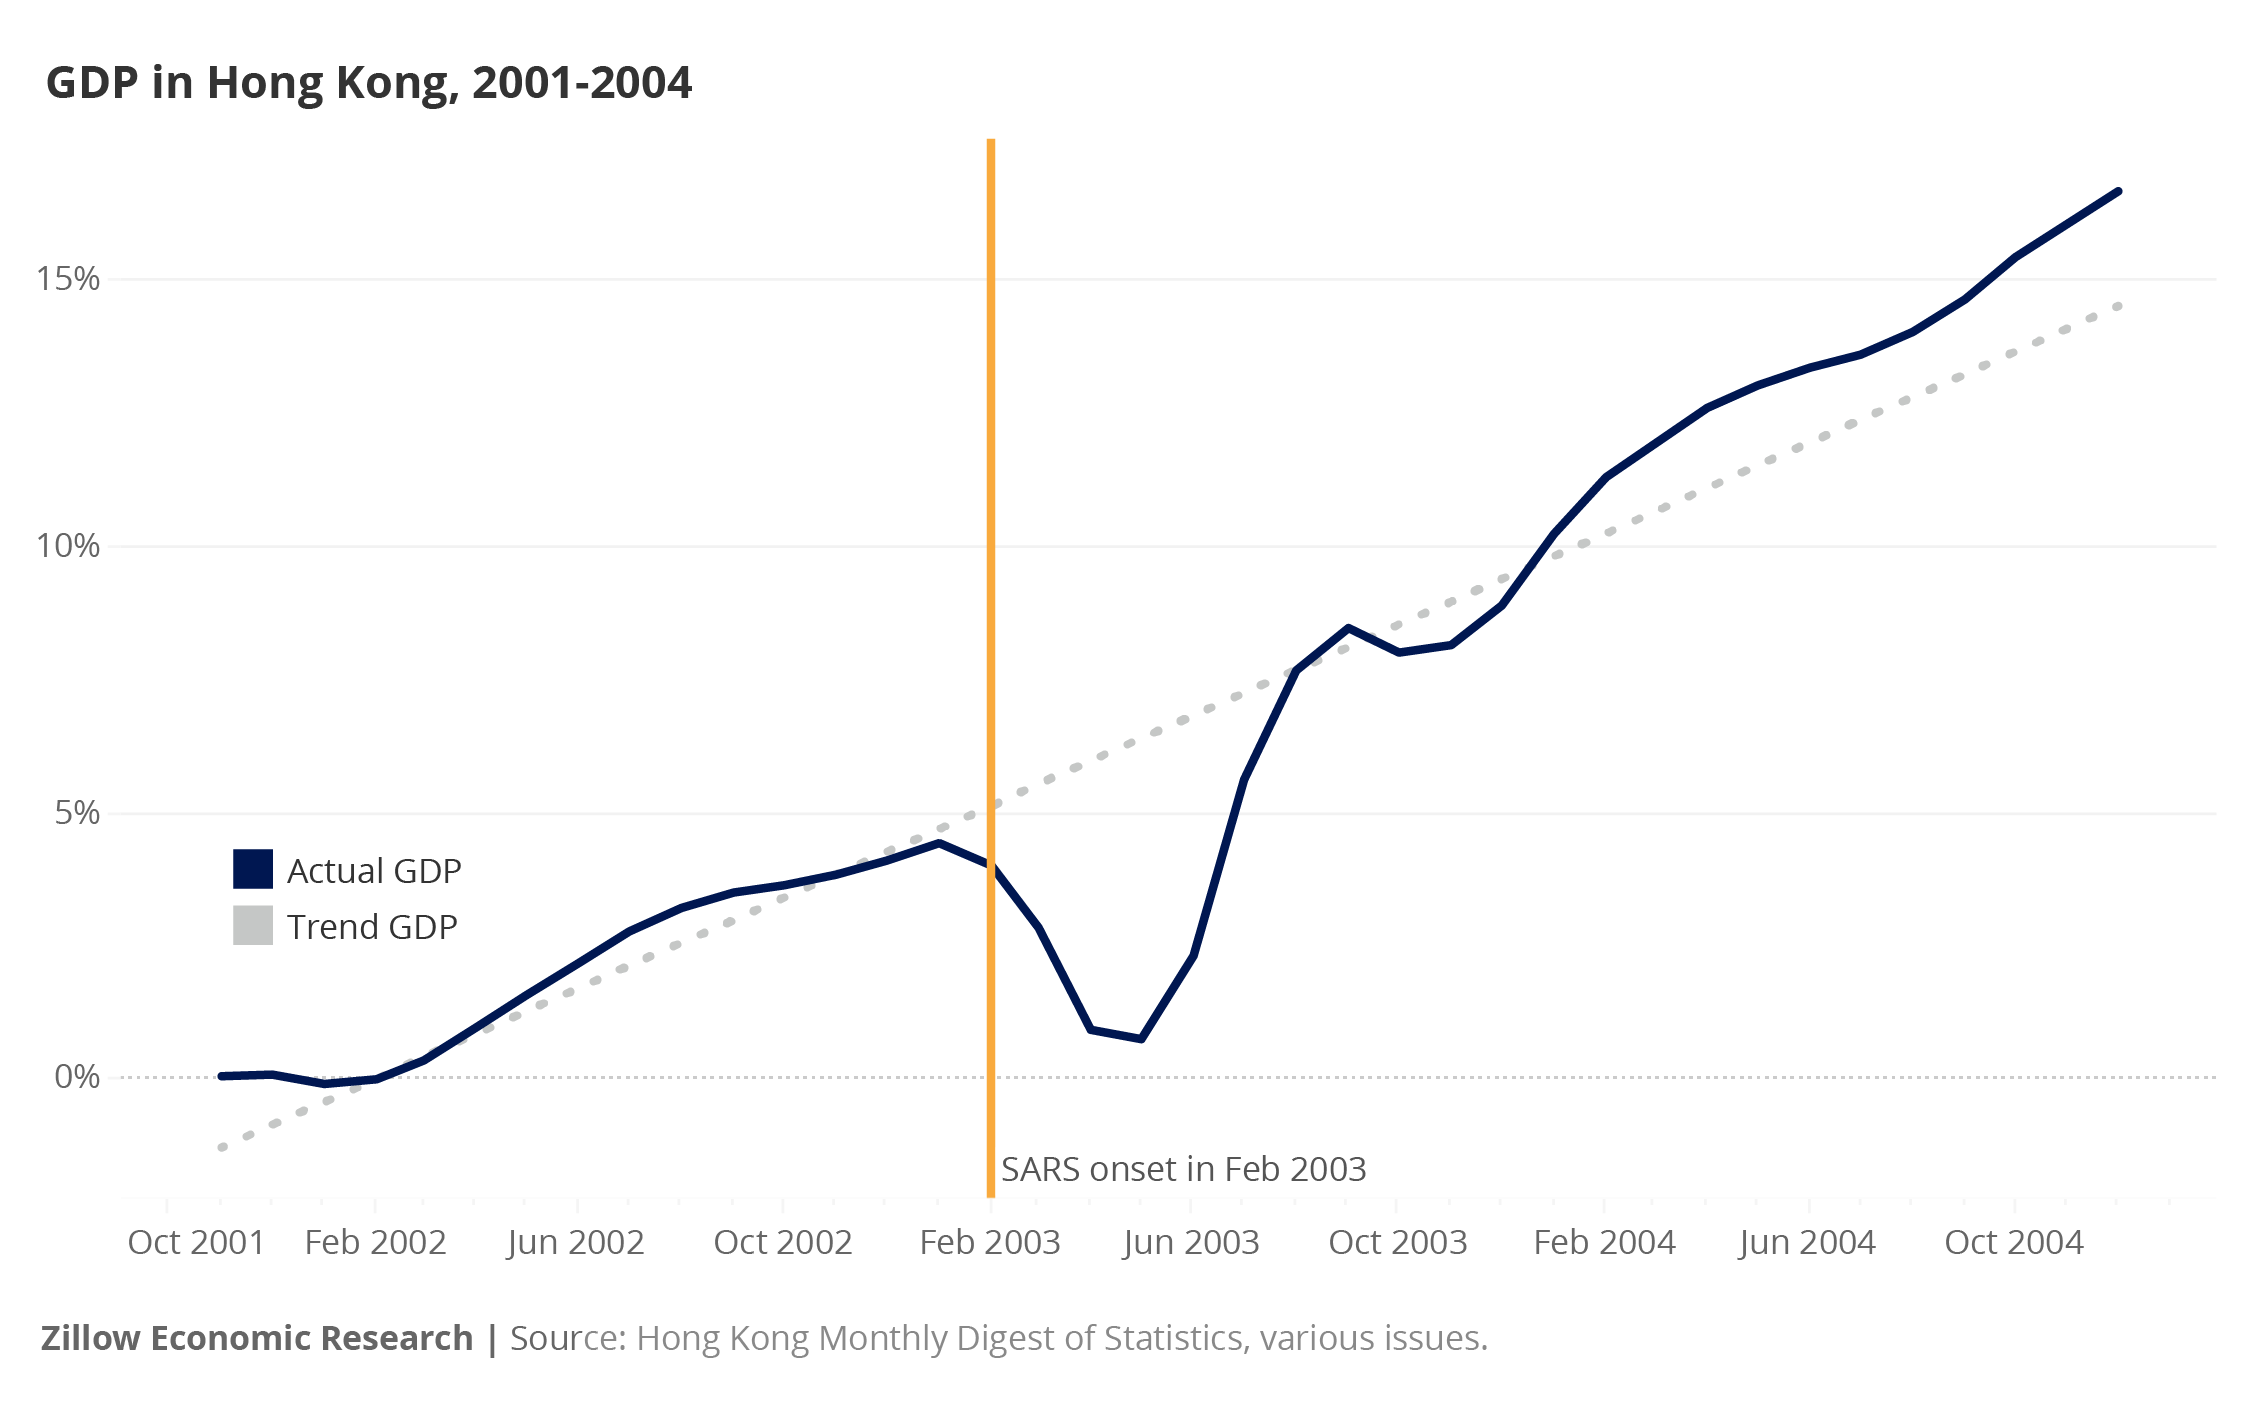
Until the onset of SARS in February, GDP was growing and unemployment was falling, consistent with an economic expansion. Then, GDP fell precipitously throughout the duration of the epidemic (by our estimation, 5-6% below trend in April and May), and unemployment rose from 7.4 percent to 8.7 percent, for a 1.3 percent increase. Once the epidemic subsided, GDP snapped back to its pre-epidemic trend, while unemployment took until the winter to recover. Altogether, the total gap between actual and trend GDP during this period is consistent with a loss of 1.75% of annual GDP as a result of SARS, which when spread over 4 months instead of 12, represents a fall in monthly GDP of 5.1%.
This loss is slightly smaller than (but of the same order of magnitude as) the model-based projections of Lee and McKibbin (2012), who predict a larger effect of the disruptions to economic activity caused by the epidemic. Lee and McKibbin simulate such an epidemic using a theoretical model (the “G-cubed” model), and they predict a loss of 2.63% of annual GDP for Hong Kong as a result of the SARS epidemic, versus a loss of 1.05% of annual GDP for China. Lee and McKibbin find that their larger loss prediction is driven by the behavior of macro policy in their model. If macro policy responds effectively to an epidemic, then the loss in output would be smaller than if it did not respond.
We also have data on the behavior of real residential real estate prices and the volume of secondary residential transactions. The chart below shows a real residential real estate price index compiled by the Bank for International Settlements (BIS) (2020), as a percent relative to a Q4 2001 or November 2001 baseline. It also shows raw transaction counts of secondary residential real estate transactions, not seasonally adjusted, from Midland Realty (2020).
By the time that SARS hit in February 2003, the Hong Kong real estate market had already experienced a downward trend in transactions and in a real residential price index. Between February and May 2003, transactions were 33% below their January 2003 value, before returning to normal by July. We note that this fall is difficult to distinguish from the preexisting downward trend. Meanwhile, real property prices fell to 1.9% below trend in May and then recovered, although this fall is difficult to distinguish from other real estate price swings that are unconnected with SARS.
Elsewhere in the literature, Wong (2008) comes to similar conclusions with respect to house prices. She finds, based on transactions data covering 44 housing estates, that the onset of SARS coincides with a 1.6% decrease in house prices versus a pre-SARS trend (which is comparable with our 1.9%). Importantly, she also finds that the onset of the SARS epidemic coincides with a 72% reduction in transaction volumes for these estates. She explains this pattern (small price reductions coincided with a large reduction in volume) as customers adopting a “wait and see” approach, whereby they avoid nonessential interactions with other people, instead waiting until the end of the epidemic to defer their transactions. This avoidance behavior is noted by Jonas (2013) as a major transmission mechanism from pandemics to economic risk.
Looking beyond real estate, Siu and Wong (2004) examine disaggregated macro data from the SARS episode, and they find that the travel, tourism, durable and semi-durable retail, and entertainment sectors were strongest hit, while production and exports were less affected. This pattern is also consistent with customers avoiding nonessential interactions, although the effect of the crisis on production and exports depends on the extent of the crisis in trading partners, and whether or not that crisis affects supply chains.
Beyond the SARS literature, there is an extensive literature on the past and likely effects of an influenza epidemic. The Congressional Budget Office (CBO) (2006) summarizes much of this literature, giving a predicted loss caused by a severe flu epidemic (similar to 1918) of about 4.25% of annual GDP and an estimated loss caused by a mild epidemic (similar to 1957 or 1968) of about 1%. In both cases, the CBO predicts that economic activity would snap back quickly after the epidemic ended, which is consistent with the data from the SARS epidemic in Hong Kong. However, since these theoretical models are mainly constructed using annual aggregates, the models do not make any specific predictions about monthly or quarterly aggregates.
Theoretical studies of influenza pandemics mostly land at losses in excess of 5% of annual GDP. For instance, a study by Kennedy, Thompson, and Vujanovic (2006) simulates a pandemic with ⅓ the mortality rate of the pandemic using a theoretical model. They find a reduction to Australian GDP of about 6%. Similarly, Douglas Szeto and Buckle (2006) predict that a severe pandemic would reduce New Zealand GDP by 5-10%. Meanwhile, McKibbon and Sidorenko (2006) predict that a severe pandemic would reduce US GDP by 5.5%, while Cooper (2006) simulates the CBO’s scenario but with disruptions to trade, and finds a 6% decline instead of a 4.25% decline in GDP. For the UK, Keogh-Brown et al. (2010) simulate mild and severe pandemics and find GDP losses of 0.6% to 2.5% for the mild scenario and 4.5% to 6% for the more severe scenario.
Contrasting with the theoretical studies, the empirical study of James and Sargent (2006) predicts that a severe flu pandemic would reduce Canadian GDP by 0.3 percent to 1.1 percent. James and Sargent base their estimates on macro data from US flu pandemics in 1918, 1957, and 1968. They find that the severe 1918 pandemic reduced annual GDP by 0.5% in 1918, with smaller effects from the other two mild pandemics. James and Sargent also cite data from the SARS outbreak, finding that while SARS severely affected tourism, travel, and services in the short run, it did not harm Hong Kong’s productive capacity in the medium run. In a similar vein, Garrett (2007) documents severe localized effects of the 1918 pandemic in places such as Little Rock, where merchants reported a 40-70% decrease in sales during the pandemic, and Memphis, where a pandemic-induced labor shortage disrupted operations. Altogether, these disruptions corresponded with a fall in a monthly industrial production index from 123.4 in July 1918 to 112.2 in October 1918 (-9.5%). The underlying data are reported by Persons (1931) and would correspond with a 2.4% fall in annual GDP for a three-month pandemic, given that industrial production is ordinarily more volatile than GDP. In addition, the Federal Reserve Bulletins from the time report significant disruptions to retail trade (up to one-third of the workforce out at any specific time) and especially to nonessential gatherings.
Altogether, the theoretical literature on influenza has given somewhat larger output losses than historical data, although the empirical literature and historical data indicate that output losses vary according to geography (harder-hit areas have higher output losses) and sector (nonessential services being hardest hit). Furthermore, trade disruptions can make the impact of the epidemic larger than it would otherwise have been.
While official data are still not yet ready for January or February 2020, unofficial data reported by Brown (2020) at Marketwatch indicate that Chinese house prices remained stable from December to January (+0.27%) although the volume of transactions has fallen by 90 to 98% from normal. This episode illustrates a particularly strong “wait and see” pattern similar to what happened during the SARS outbreak–customers are not going to walk-throughs or closing on transactions in person. Data in upcoming weeks will tell us how long this outbreak lasts in China.
Additionally, a report by Hatzius et al. (2020) at Goldman Sachs shows detailed activity data from China during the current episode. The Hatzius report corroborates the Brown report–property transactions and transportation have nearly ceased due to avoidance behavior (some of it driven by a public policy response) while the consumption of coal fell by only 30% year over year, since people still need to heat their homes.
………………..
Bank for International Settlements (BIS), 2020, via FRED Database. “Selected residential property price series – data documentation”. Source: National sources, BIS residential property price database (http://www.bis.org/statistics/pp.htm). FRED URL: https://fred.stlouisfed.org/series/QHKR628BIS
Brown, Tanner, 2020. “Coronavirus slows China’s property market to a crawl — and even the most robust real-estate app is no match.” Marketwatch, Feb. 21, 2020, retrieved on Feb. 28, 2020. URL: https://www.marketwatch.com/story/coronavirus-slows-chinas-property-market-to-a-crawl-and-even-the-most-robust-real-estate-app-is-no-match-2020-02-18
Census and Statistics Department, Hong Kong Special Administrative Region, 2020. Hong Kong Monthly Digest of Statistics, various issues.
Congressional Budget Office (CBO), 2006. “A Potential Influenza Pandemic: An Update on Possible Macroeconomic Effects and Policy Issues.” Manuscript, Congressional Budget Office. URL: https://www.cbo.gov/publication/17785
Cooper, Sherry, 2006. “The Avian Flu Crisis: An Economic Update.” Manuscript, BMO Nesbitt-Burns.
Douglas, James, Kam Szeto, and Bob Buckle, 2006. “Impacts of a Potential Influenza Pandemic on New Zealand’s Macroeconomy.” Policy Perspective Paper 06/03, New Zealand Treasury. Retrieved February 28, 2020. URL:
Federal Reserve Bulletin, various issues, via Thomson Reuters. “References to ‘influenza’ in the monthly Federal Reserve Bulletin during 1918 and 1919.” Retrieved on Feb. 28, 2020. URL: https://fingfx.thomsonreuters.com/gfx/ce/7/8626/8607/INFLUENZA%20REFERENCES%20IN%20THE%20FEDERAL%20RESERVE%20BULLETIN%201918-19.pdf
Fernández R.B. 1981. “A methodological note on the estimation of time series,” The Review of Economics and Statistics 63, pages 471-478. URL: https://www.jstor.org/stable/1924371?seq=1
Garrett, Thomas A., 2007. “Economic Effects of the 1918 Influenza Pandemic.” Manuscript, Federal Reserve Bank of St. Louis. Retrieved on Feb. 27, 2020. URL: https://www.stlouisfed.org/~/media/files/pdfs/community-development/research-reports/pandemic_flu_report.pdf
Goldman Sachs, 2020. “A Larger Virus Hit and Another Round of Rate Cuts.” US Economics Analyst, March 1, 2020. Retrieved March 2, 2020. URL: https://research.gs.com/content/research/en/reports/2020/03/01/31bfffb7-f94a-4c0e-b0d6-49b1468aed2f.html
Hatzius, Jan, Daan Struyven, David Choi, and David Mericle, 2020. “A Viral Global Slowdown.” Global Economics Analyst, Goldman Sachs Economic Research. Retrieved on March 1, 2020. URL: https://research.gs.com/content/research/en/reports/2020/02/28/ae384520-6a4b-415d-a6e6-6fa28e8e25ee.html
Kennedy, Steven, Jim Thompson, and Petar Vujanovic. “A Primer on the Macroeconomic Effects of an Influenza Pandemic.” Working Paper 2006-11, Treasury of Australia. Retrieved on Feb. 27, 2020. URL: https://pdfs.semanticscholar.org/f605/da3a347548d5635e425a5531fdb64cd19c8d.pdf?_ga=2.70573072.1412815931.1583204112-1096427715.1583204112
James, Steven, and Timothy Sargent, 2006. “The Economic Impact of an Influenza Pandemic.” Mimeo, Economic Analysis and Forecasting Division, Department of Finance, Government of Canada. Retrieved on Feb. 27, 2020. URL: https://www.publicsafety.gc.ca/lbrr/archives/cn000034577651-eng.pdf
James, Steven, and Timothy Sargent, 2006a. “The Economic Impact of SARS and Pandemic Influenza.” In: SARS in Context: Memory, History, Policy, ed. Jacalyn Duffin and Arthur Sweetman. McGill-Queen’s Press. Retrieved on Mar. 1, 2020. URL: https://www.google.com/books/edition/SARS_in_Context/xAibijIszawC?hl=en&gbpv=1&printsec=frontcover
Jonas, Olga, 2013. “Pandemic Risk.” World Development Report Background Paper, the World Bank. Retrieved on Feb. 27, 2020. URL: http://siteresources.worldbank.org/EXTNWDR2013/Resources/8258024-1352909193861/8936935-1356011448215/8986901-1380568255405/WDR14_bp_Pandemic_Risk_Jonas.pdf
Keogh-Brown, Marcus, Simon Wren-Lewis, W. John Edmunds, Philippe Beutels, and Richard D. Smith, 2010. “The Possible Macroeconomic Impact on the UK of an Influenza Epidemic.” Health Economics 19(11), pages 1345-1360. Retrieved on Feb. 28, 2020. Working paper version URL: https://www.gtap.agecon.purdue.edu/resources/download/3828.pdf
Lee, Jong-Wha, and Warwick J. McKibbin, 2012. “The Impact of SARS,” in China: New Engine of World Growth, Garnaut, Ross, and Ligang Song, eds. ANU Press. Retrieved on Feb. 28, 2020. URL: https://www.jstor.org/stable/j.ctt24h9qh.10?seq=1#metadata_info_tab_contents
McKibbin, Warwick J., and Alexandra Sidorenko, 2006. “Global Consequences of Pandemic Influenza.” Manuscript, Brookings Institution, Lowy Institute for International Policy. Retrieved on Feb. 27, 2020. URL: https://www.brookings.edu/research/global-macroeconomic-consequences-of-pandemic-influenza/
Midland Realty, 2020. “Statistics of Properties Transactions in Land Registry – Last 12 Months.” Retrieved on February 28, 2020. URL: https://en.midland.com.hk/land-registry-record/12months.html
Persons, W.M., 1931. Forecasting Business Cycles. John Wiley, New York, pages 93-143. Data available in the NBER Macrohistory database, via the St. Louis Fed FRED database. Retrieved on Feb. 28, 2020. URL: https://fred.stlouisfed.org/series/M1204BUSM363SNBR
PredictIt, 2020. “Will there be a recession in Trump’s 1st term?” Retrieved March 2, 2020. URL: https://www.predictit.org/markets/detail/4292/Will-there-be-a-recession-in-Trump’s-1st-term
Siu, Alan, and Y.C. Richard Wong, 2004. “The Economic Impact of SARS: The Case of Hong Kong.” Asian Economic Papers 3:1, pages 62-83. Retrieved on Feb. 27, 2020. URL: https://hub.hku.hk/bitstream/10722/88855/1/content.pdf
Wong, Grace, 2008. “Has SARS Infected the Property Market? Evidence from Hong Kong.” Journal of Urban Economics 63(1), pages 74-05. Retrieved on Feb. 27, 2020. URL: https://www.sciencedirect.com/science/article/pii/S0094119007000095
