
Public Pension Investment Update: Have Alternatives Helped or Hurt?

The brief’s key findings are:
- In FY 2022, public pension plans experienced negative asset returns, and some say it could have been even worse without alternative investments.
- But the real question is have alternatives (private equity, hedge funds, real estate, and commodities) helped or hurt over the long term?
- The results suggest that, from 2001-2022, alternatives have not helped overall returns – although they may have reduced volatility.
Introduction
Fiscal year 2022 was a difficult one for state and local pension plans, with the decline in the stock market erasing much of the gains from 2021. And, recent media reports by Pensions and Investments, the Wall Street Journal, and others have suggested that alternative investments are one reason why reported returns don’t look worse.1See Gillers (2022), Gillers and Rabouin (2022), and Jacobius (2022). But focusing on the short-term impact of specific asset classes ignores the fact that public pensions are long-term investors. The key question is: have alternatives helped or hurt pension funds’ long-term investment performance?
The discussion proceeds as follows. The first section reports the long-term performance of public plans since 2001 – including the poor results of 2022. The second section documents public plans’ increasing reliance on alternative investments since 2001. The third section examines how the shift towards more alternatives has affected the overall investment performance of public plans. The final section concludes that the performance of pension funds since 2001 has fallen short of actuarial expectations and that the increasing reliance on alternatives certainly has not helped, although it may have dampened reported volatility.
Update on Public Pension Investment Returns
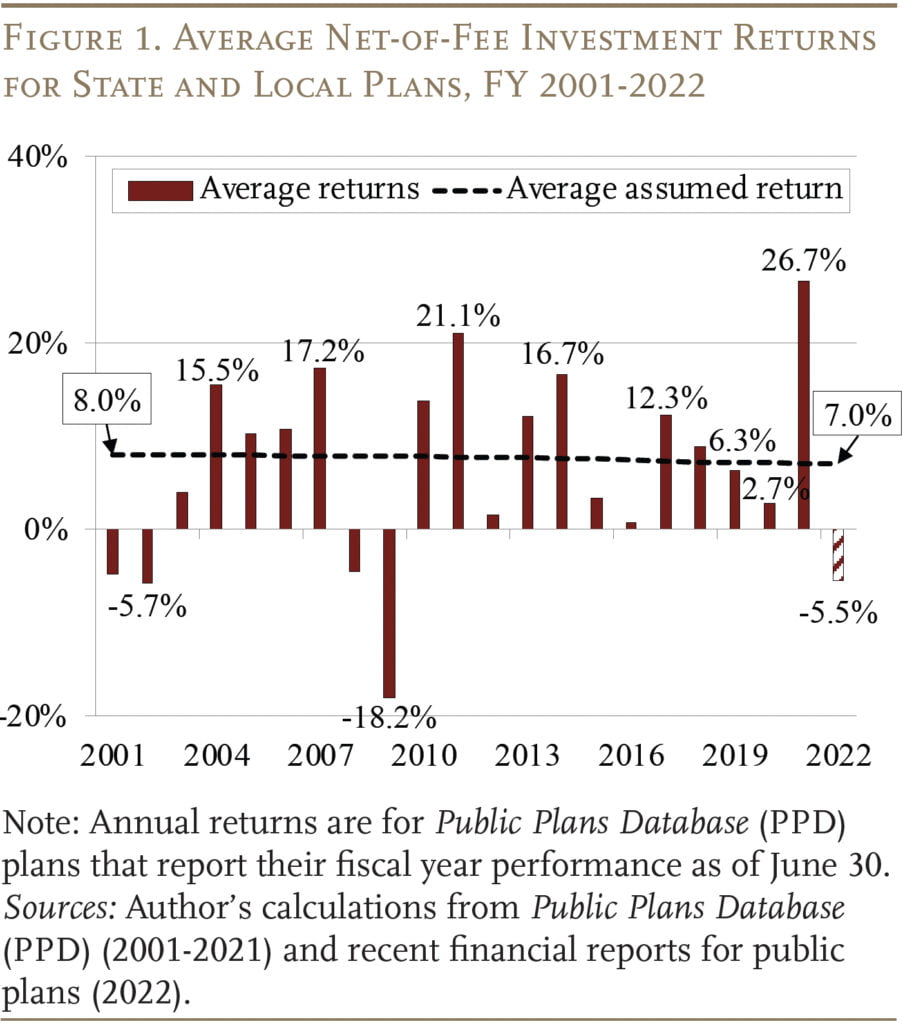
In FY 2021, all state and local plans exceeded their actuarially assumed return, with an average return of about 27 percent compared to the average assumed return of about 7 percent.2The analyses in this brief are based on the Public Plans Database (PPD), which consists of roughly 220 major public pension plans (118 state and 100 local) that represent over 95 percent of total U.S. state and local pension assets and membership. In the PPD, roughly 75 percent of plans – representing 70 percent of the PPD assets – report fiscal year performance as of June 30, 25 percent of plans report as of December 31, and the remaining plans report as of the last day in either August, September, March, or April. The 26.7-percent return for FY 2021 reflects the 1-year return for plans that report fiscal year performance as of June 30. The FY 2021 performance for all PPD plans was 24.1 percent. However, during FY 2022 the financial markets dropped substantially – with public pensions averaging a negative return of 5.5 percent (see Figure 1). 3The CRR obtained quarterly investment reports as of June 30, 2022 for about 170 PPD plans. Of these plans, about 110 report fiscal year performance as of June 30. The negative 5.5-percent return reflects the 1-year return as of June 30 for these 110 plans. The 1-year return as of June 30 for all 170 plans was negative 7.1 percent. The dramatic whipsaw in fortunes exemplifies how short-term returns can be problematic for gauging whether pension fund investment performance is adequate. In fact, reviewing performance since 2001 shows that the returns in 2021 and 2022 – while dramatic – continue a historical pattern in which returns come in above the average assumed return about as often as they fall below.
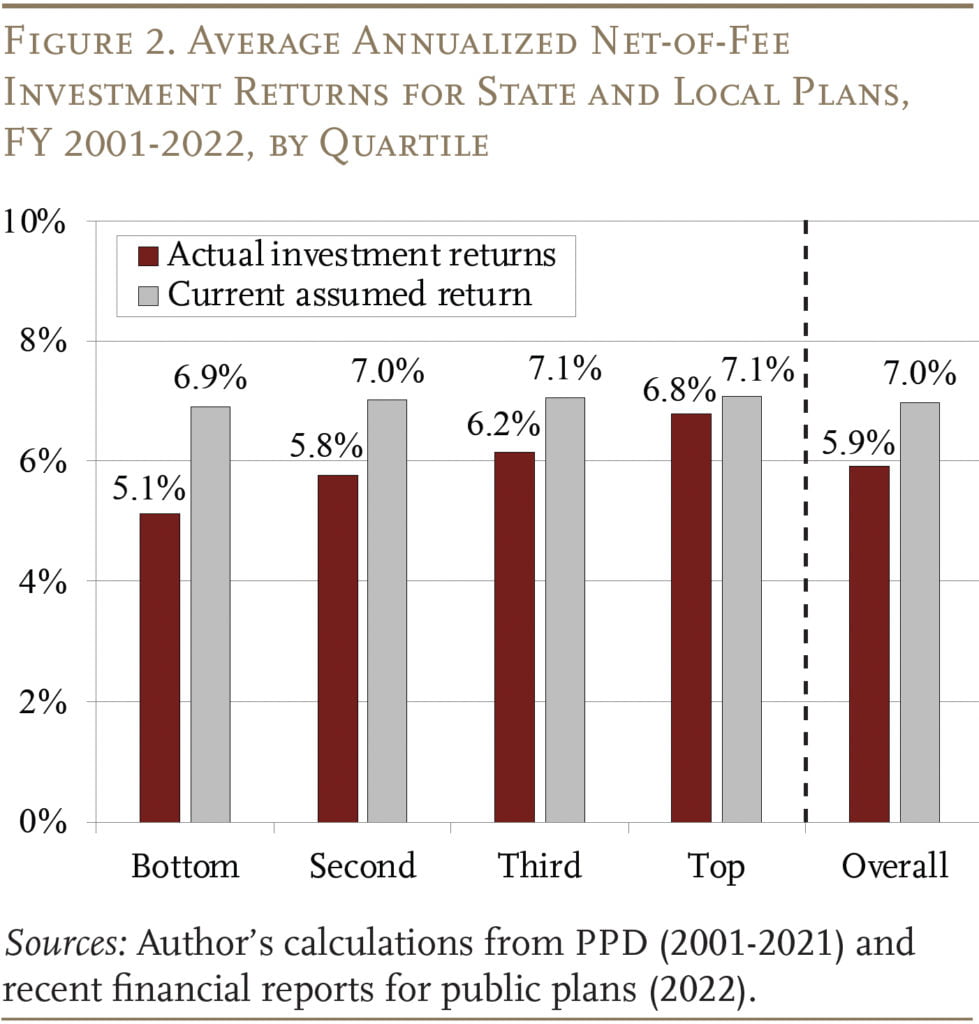
Given the pattern of annual returns above and below expectations since 2001, one might think that performance over the period has roughly met expectations. However, the year-by-year data do not accurately depict the plans’ long-term performance. Calculating the annualized return (i.e., the geometric return) from 2001-2022, public plans have averaged only 5.9 percent over the last 22 years.4Of course, the annualized return varies depending on the time period being assessed. Based on the PPD, the average annualized net-of-fee return over the last 10 and 15 years was 7.8 percent and 5.8 percent, respectively. And, based on the U.S. Census Bureau, the aggregate annualized net-of-fee return over the last 30 years was 8.6 percent (U.S. Census of Governments, 2022). And, while virtually all plans have fallen short of their expectations, some have fared much worse than others.5Although plans have incrementally reduced their actuarially assumed return from about 8 percent in 2001 to about 7 percent in 2022, their cumulative realized returns over this period have fallen well short of actuarial expectations. Importantly, the decline in the assumed return has been mostly due to lower inflation and low interest rates. To offset this decline, plans have shifted away from fixed income and into riskier asset classes. By shifting into riskier assets, most plans have actually increased their real return assumption (that is, the expected return net of inflation). For an analysis of these trends, see Aubry, Munnell, and Wandrei (2019). Plans in the top quartile of investment returns earned 6.8 percent on average, while plans in the bottom quartile earned only 5.1 percent (see Figure 2).
The Role of Alternative Investments
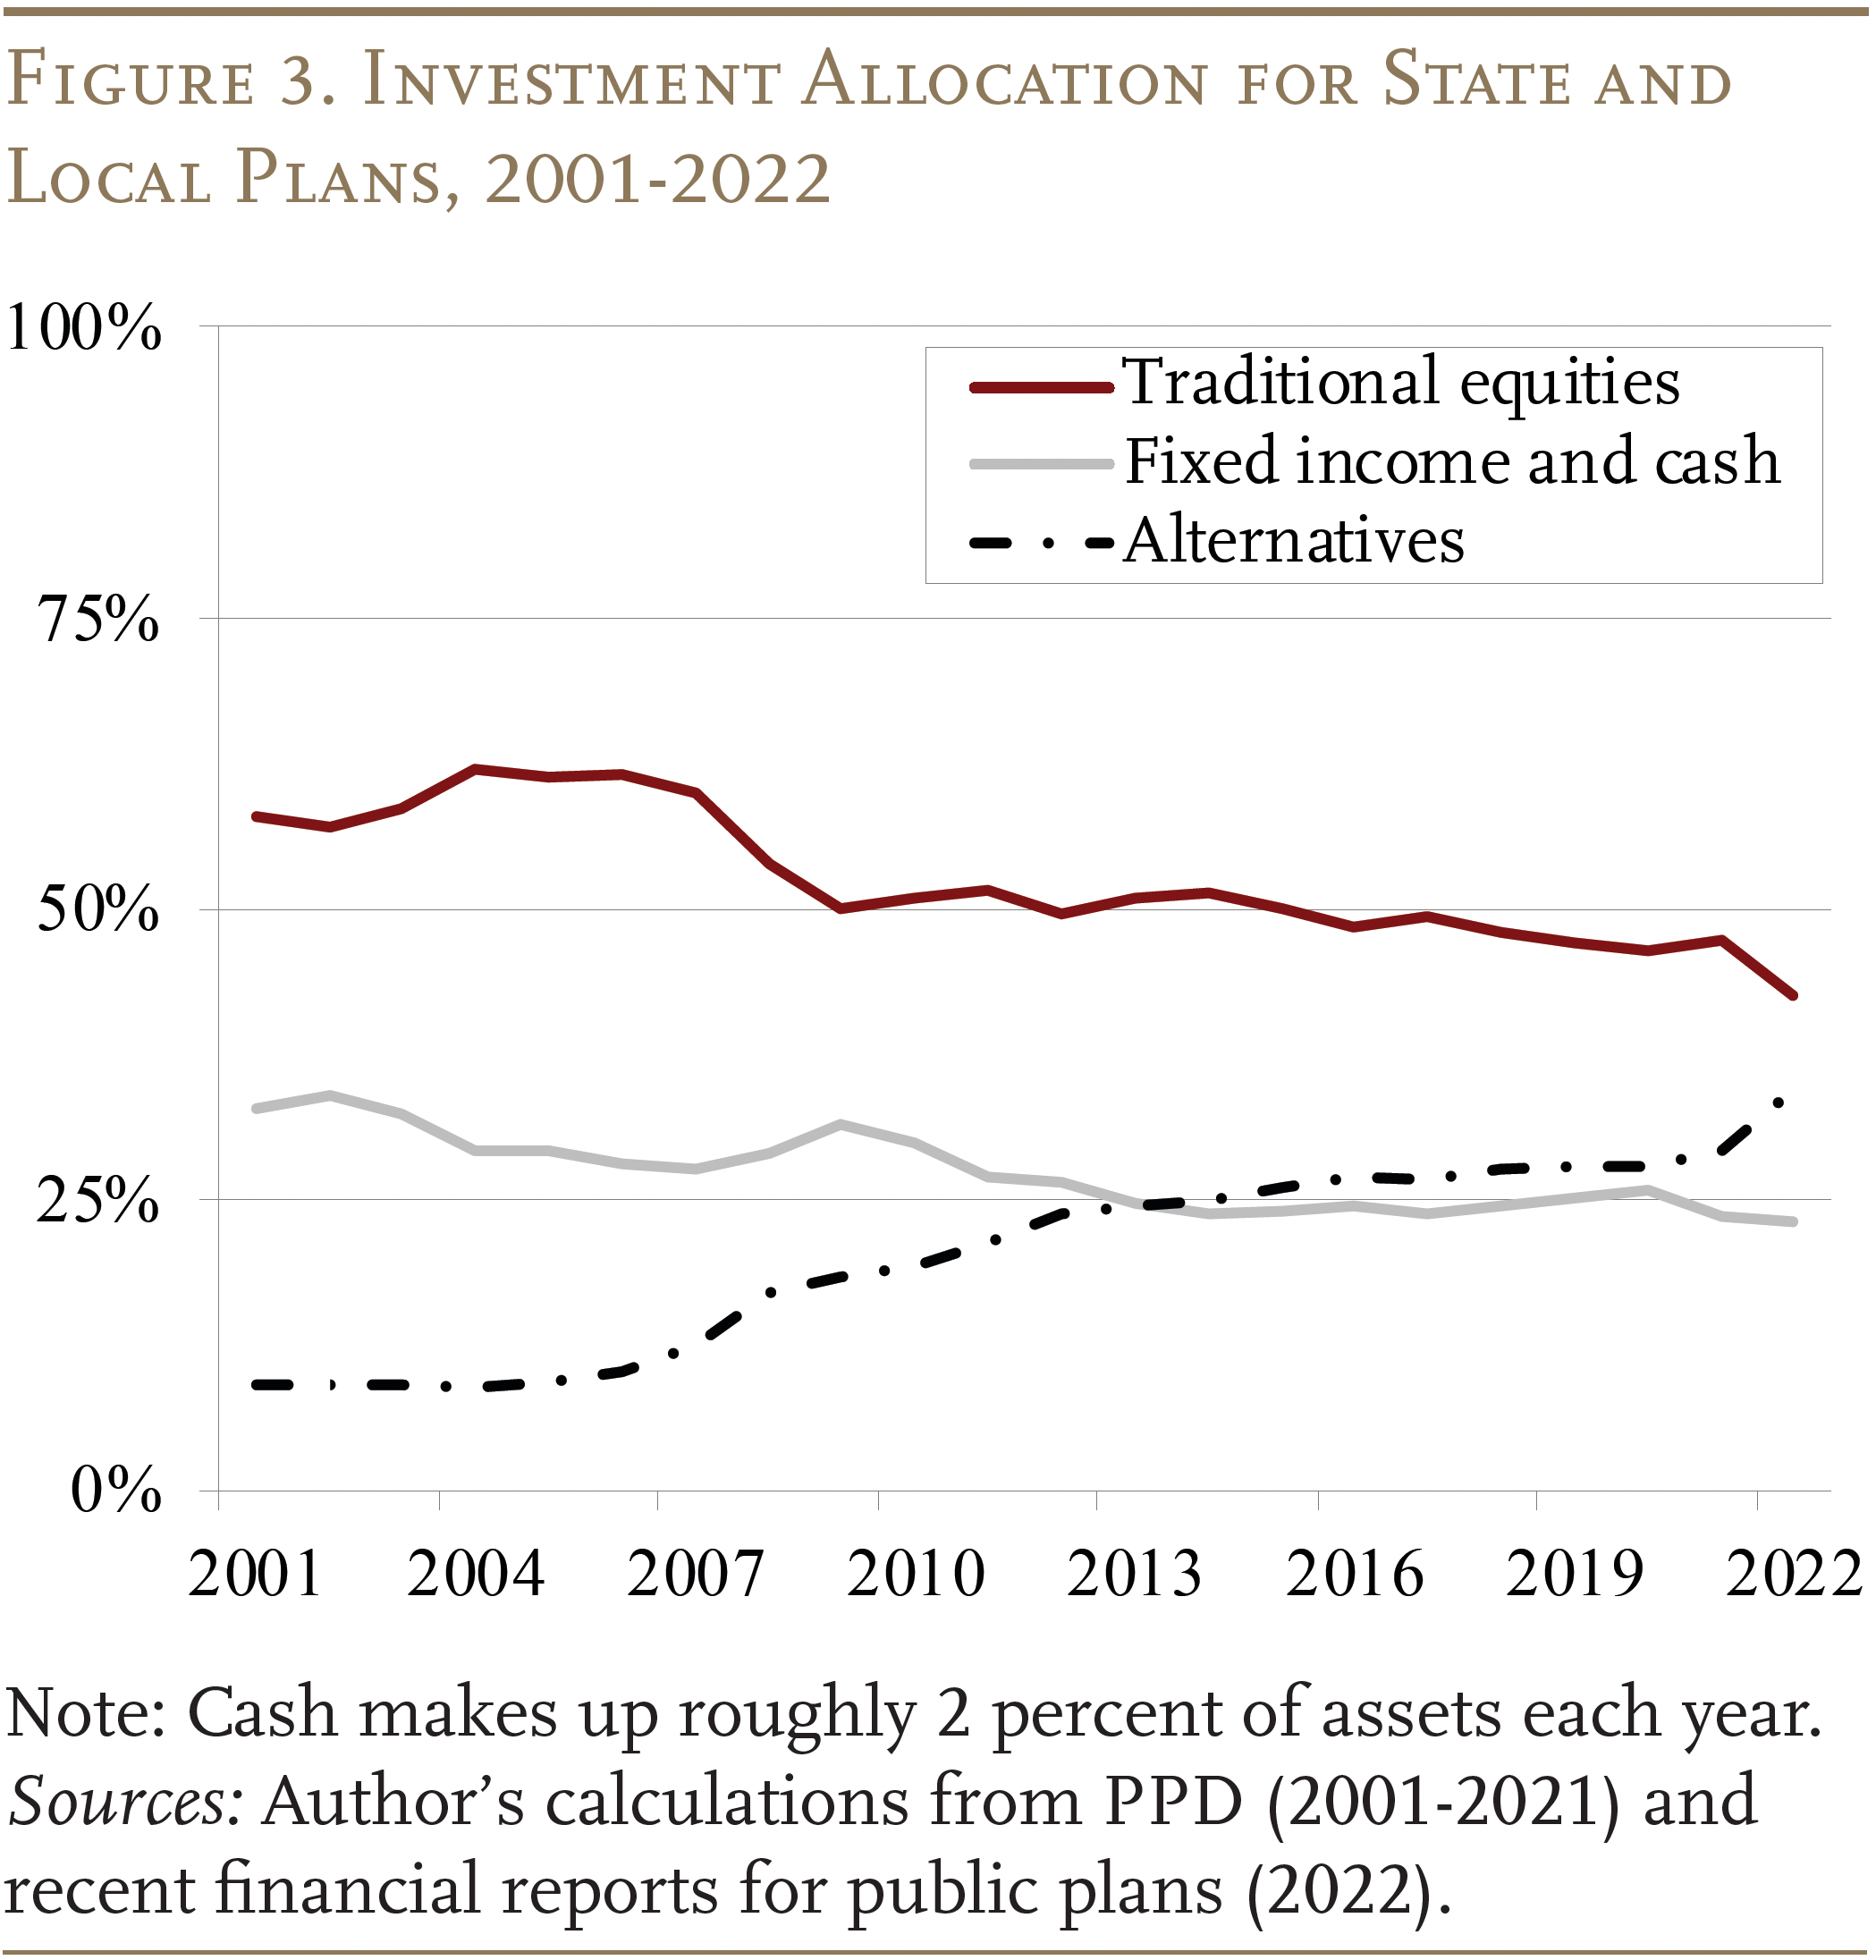
One of the most significant shifts in public pension investment policy over the past two decades has been the expansion into alternative investments – namely, private equity, hedge funds, real estate, and commodities.6The definition of alternative investments is somewhat fluid. For that reason, we define them by what they are not: they are not traditional stocks, bonds, and cash – held directly or in mutual funds. All other investments are classified as “alternatives.” For a broader discussion on alternative investments by public pensions, see Aubry, Chen, and Munnell (2017). For public pension funds, the aggregate allocation to alternatives first began to rise in 2005 (see Figure 3). Almost by definition, the precipitous drop in equity values compared to other assets in 2008 and 2009 led to further increases in the shares held in all other asset classes. As the stock market recovered, however, the allocation to traditional equity remained depressed, suggesting that plans were making deliberate shifts toward alternative investments. Overall, state and local plans have increased their holdings from 9 percent in 2001 to 34 percent in 2022.
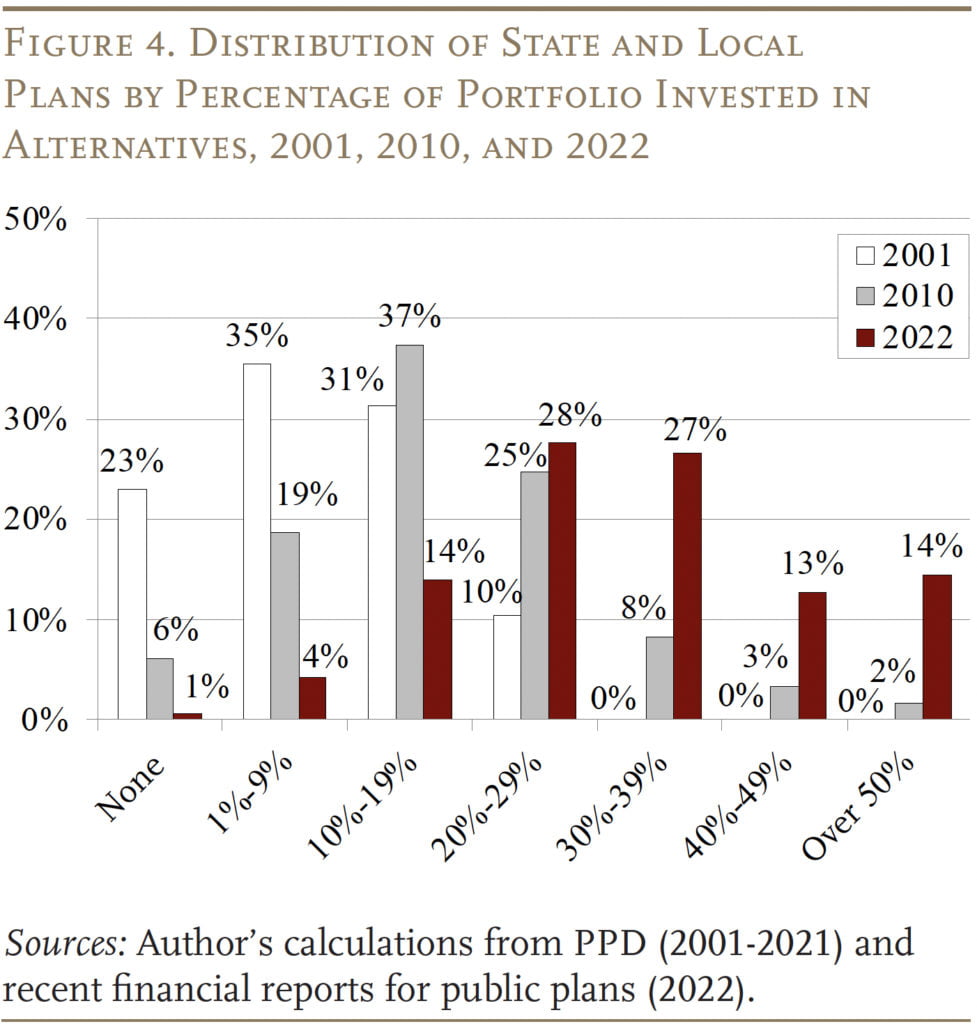
Aggregate allocations, however, hide some significant variation among plans, so Figure 4 shows both how holdings have increased from 2001 to 2022, and how they vary among plans in each year. In 2001, the maximum share held in alternatives by any plan was under 30 percent and almost three-fifths of plans held less than 10 percent. By 2022, the maximum held was over 50 percent and only 5 percent of plans held less than 10 percent.
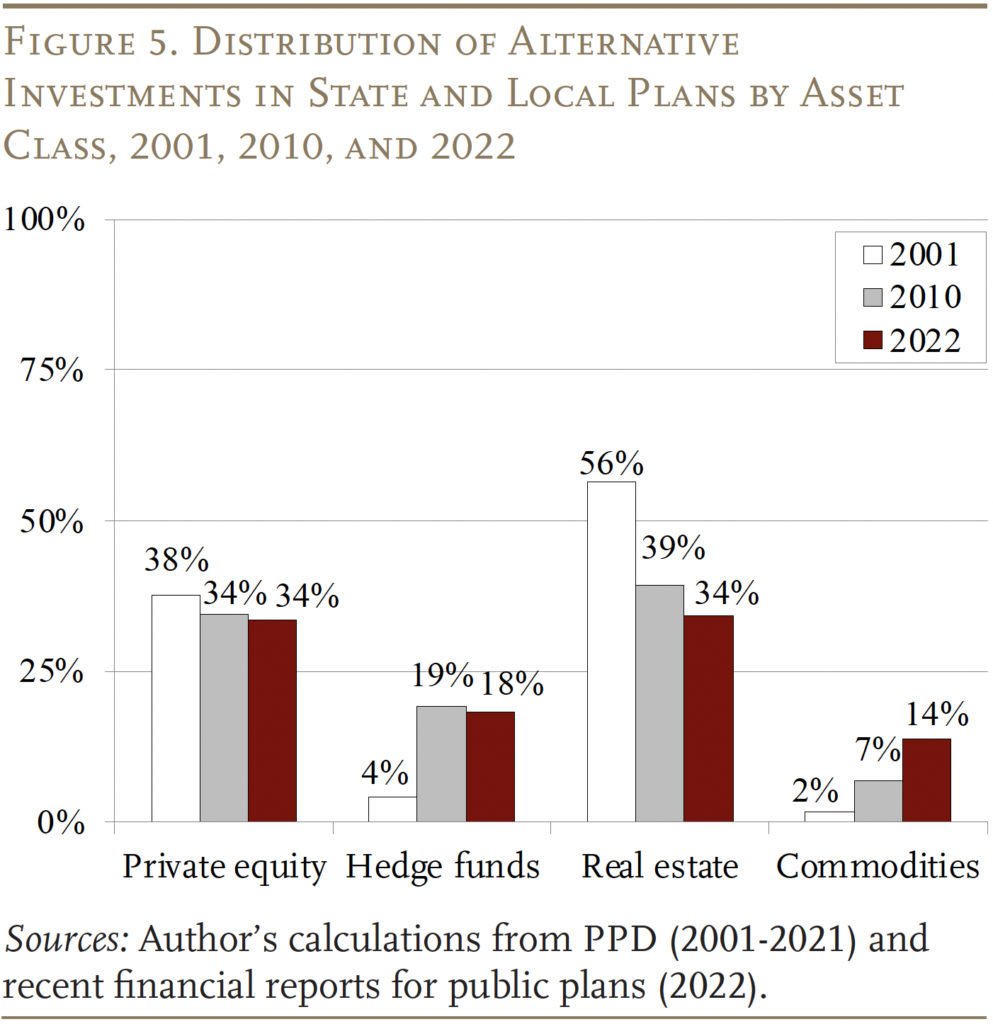
Not only have alternatives become a much larger share of public plans’ portfolios, but their composition has also changed. As shown in Figure 5, between 2001 and 2022, the portion of alternative investments allocated to real estate dropped sharply, while allocations to hedge funds and commodities have grown.
How Has the Shift to Alternatives Affected Investment Performance?
It is natural to wonder whether the shift toward alternatives has helped or hurt pension fund investment performance. However, studying the impact of alternatives is complicated by the fact that the reported fair value for many alternative investments is based on expert appraisals that may differ meaningfully from the true market value (e.g., the difference between the appraised value of a property for the purposes of a bank loan and the value of the property at sale). Additionally, pension plans often report performance for privately-held alternatives – such as private real estate and private equity – with a quarter lag.7Out of 160 PPD plans reviewed, 130 reported the performance of private assets with a quarter lag. As a result, the yearly performance reported for many pension plans often contains imprecise and outdated valuations of alternatives.
Focusing on long-term performance helps mitigate some of these issues. First, longer periods increased the probability that an asset will be sold within the assessment period – once the asset is sold, the total investment gain is realized and any errors in prior valuations are moot. Second, for those assets which are not sold, the impact of lagged reporting tends to net out when combining annual reported returns to estimate long-term performance – to the extent that lagged valuations overstate yearly performance during market declines, they also understate the performance during the subsequent market rebounds.
Returns for Alternatives Relative to Traditional Equities
The investigation into alternatives and investment returns begins by documenting the returns for broad indices of alternatives and traditional equities before, during, and after the global financial crisis (see Table 1). These data need to be interpreted cautiously for a number of reasons. First, private equity and real estate returns are shown before fees, while hedge fund and commodity returns are after fees. Second, the data for private equity and hedge funds are supplied on a voluntary basis, and strong performers have a greater incentive to report than those who perform poorly. Third, failed funds are removed from indices, resulting in consistent overweighting toward better performers (survivorship bias). Finally, when a private equity firm or hedge fund provides data to an index, it can report as much (or as little) of its historical performance as it wants, so that strong performers would have an incentive to provide more data compared to weak performers (backfill bias). As a result, these benchmarks tend to overstate the actual returns that are earned.8These biases can have a large effect. Ibbotson, Chen, and Zhu (2011) found that accounting for survivorship and backfill bias in the average return for hedge funds reduced the return from 14.9 percent to 7.7 percent over the period 1995-2009. Of course, since these data represent averages, some individual funds may have had much better (or worse) returns. For a detailed overview of the different types of biases, see Ilmanen (2012).
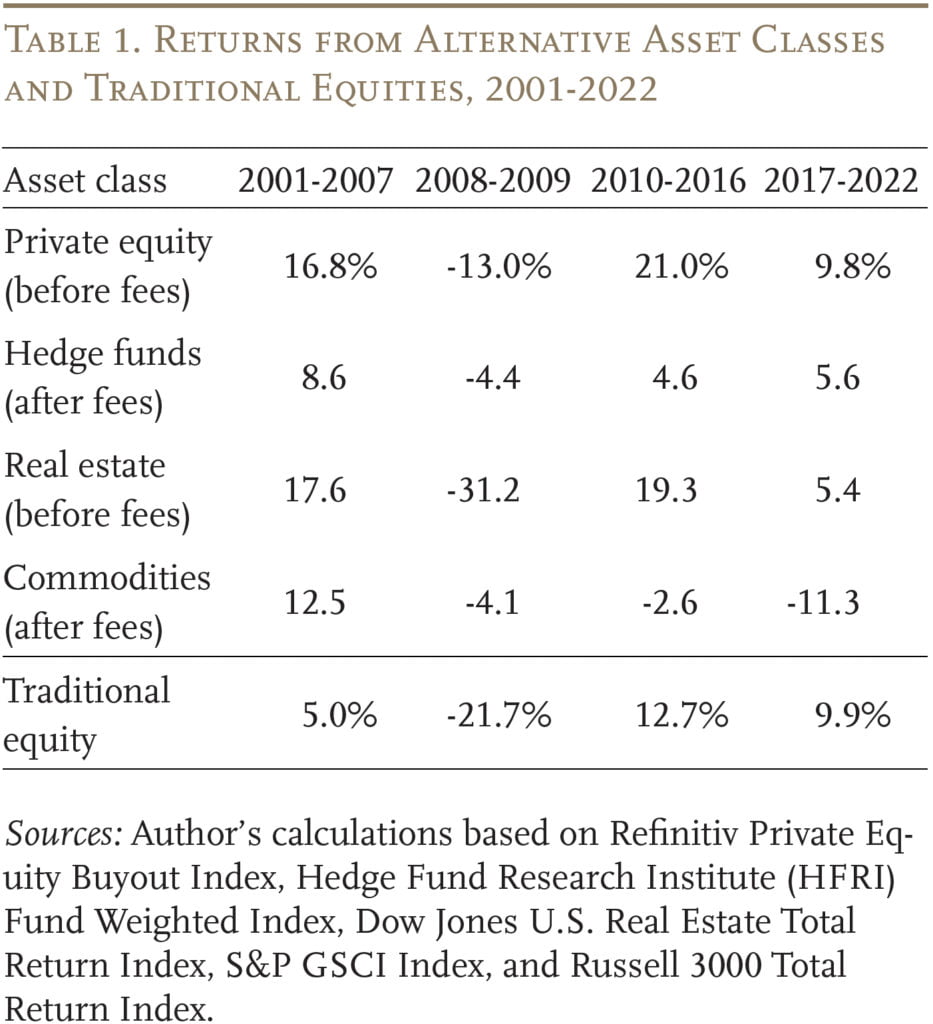
Even with these limitations, it is fair to conclude that alternative investments had robust returns between 2001 and 2007 – substantially outpacing traditional equities. And, other than real estate (which was a core component of the 2008-2009 financial collapse in the U.S.), alternatives lost substantially less than traditional equities during the financial crisis. This performance, combined with a desire to diversify away from poorly performing stocks and lower-yielding bonds, may have led state and local plans to increase their interest in alternatives coming out of the crisis. However, since the crisis, the performance of alternatives has been more mixed, with private equity and real estate rebounding somewhat, while hedge funds and commodities continue to provide lower returns.
The Impact of Alternatives on Long-Term Returns
To test the relationship between pension funds’ allocations to alternatives and their overall portfolio performance, the brief uses regression analysis to study three periods: 2001 to 2009 (before and during the global financial crisis), 2010 to 2022 (post-crisis), and 2001 to 2022 (pre- and post-crisis).
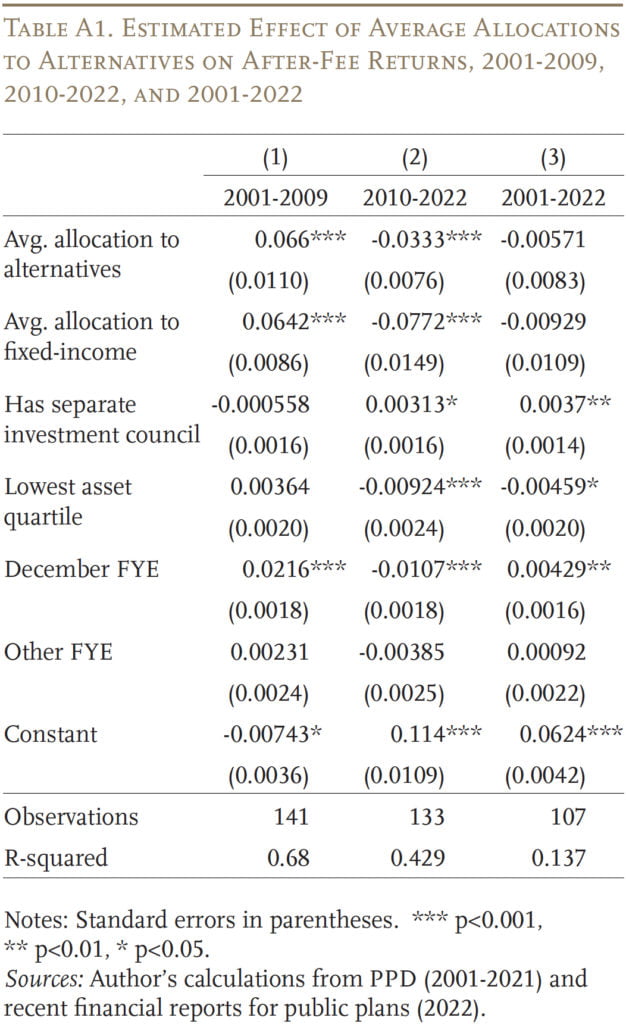
The first regression relates the annualized portfolio return (i.e., the geometric return) over each period to the average allocation to alternatives over that same period. To assess the performance of alternatives relative to traditional equities, the regression controls for the allocation to fixed income and cash. Because plan size and investment expertise could also be important, the regression controls for the size of the assets at the beginning of the period and whether the pension plan has a separate investment council. Finally, to compare plans with the same reporting date, we control for the fiscal year end used by each plan.9Specifically, the regression includes a flag for whether the plan is in the lowest asset quartile in the beginning of the period and flags for whether the plan’s most common fiscal year end date over the period is either June 30, December 31, or some other date. The results show that, relative to traditional equities, holding 10 percent more of the plan’s portfolio in alternatives is associated with a 66-basis-point increase in the portfolio return from 2001 to 2009 and a 33-basis-point decrease in the return from 2010-2022 (see Figure 6).
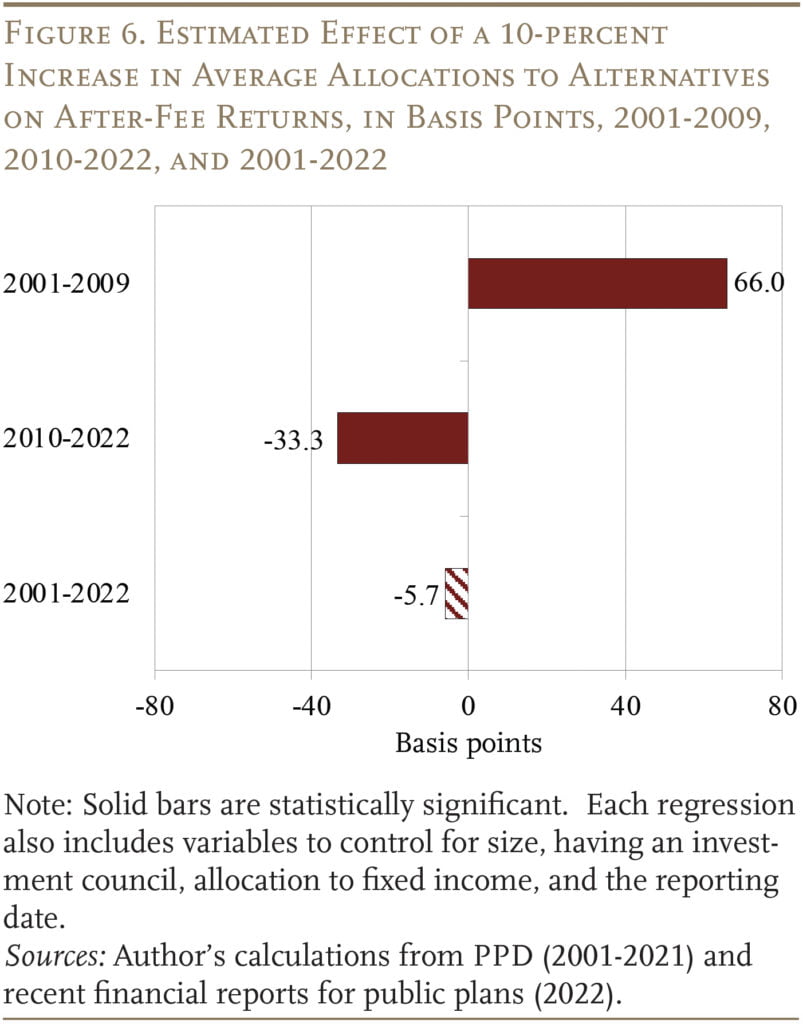
Given the opposing results before and after the global financial crisis, it is perhaps unsurprising that the allocation to alternatives had no statistically significant impact on returns when looking over the whole period from 2001 to 2022. (See full results in Appendix Table A1.)
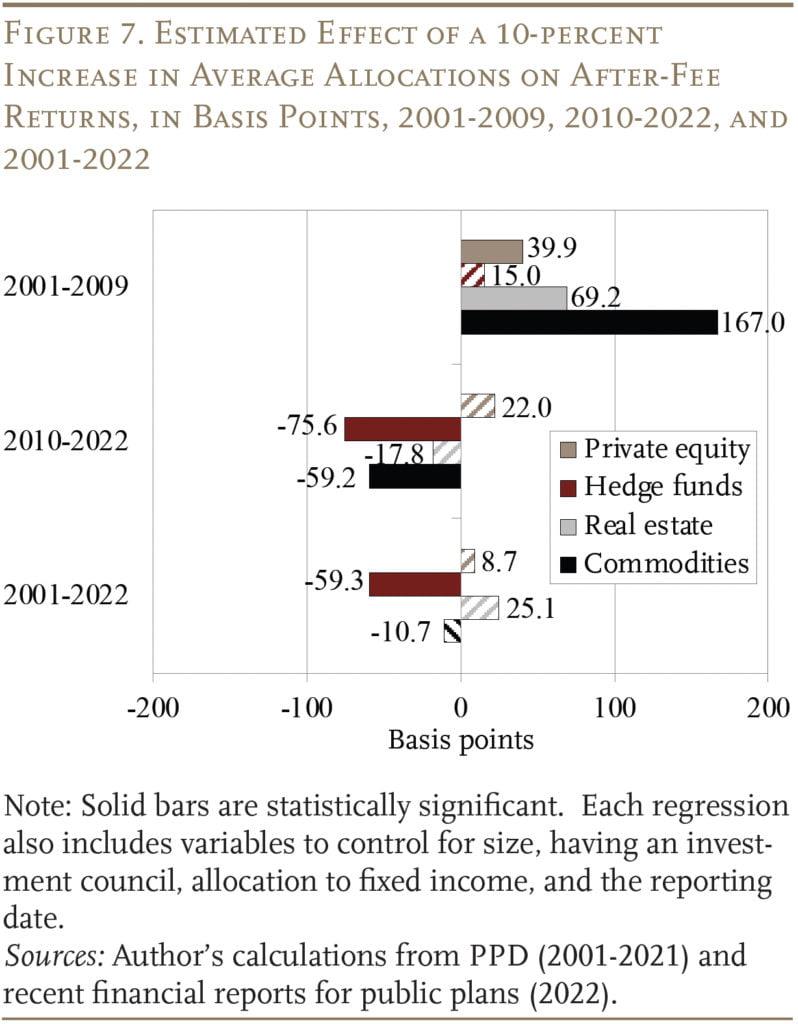
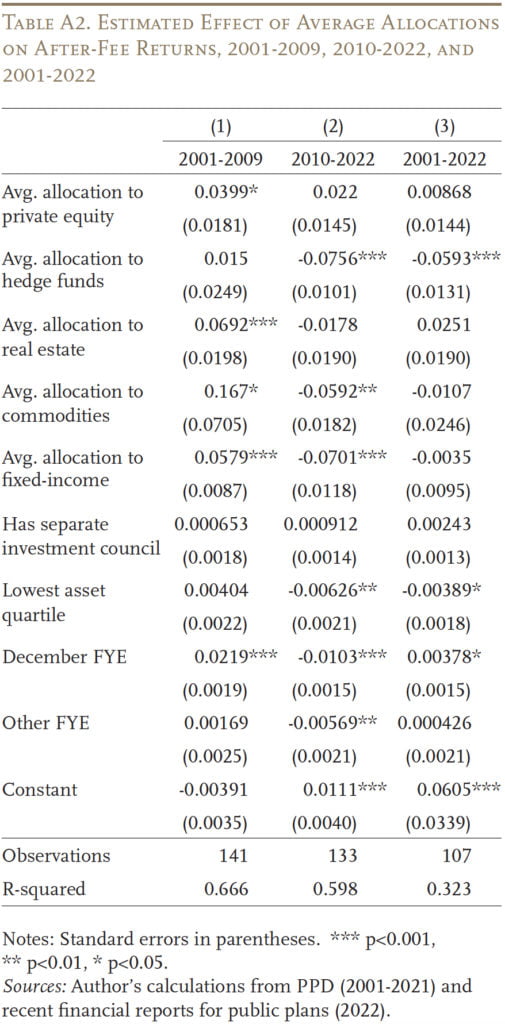
One problem with the above equation is that it treats alternatives as a single asset class – which they clearly are not. Therefore, the second equation relates the annualized portfolio return to holdings in each of the four major alternative asset classes, plus the controls described above. The results show that, from 2001 to 2009, all but hedge funds helped returns relative to equities (see Figure 7).10See full results in Appendix Table A2. This finding is consistent with Table 1 and the effect for total alternatives in Figure 6. From 2010 to 2022, both hedge funds and commodities performed less well than equities. This pattern is again consistent with Table 1 and helped to drive the negative effect for total alternatives in Figure 6. The other interesting result is that the effects of private equity and real estate are not statistically significant over this period, suggesting that – at least since 2010 – some plans could have done just as well by investing in traditional equities. Finally, over the whole period, only hedge funds had a statistically significant impact, and it was negative.
The Impact of Alternatives on the Volatility of Returns
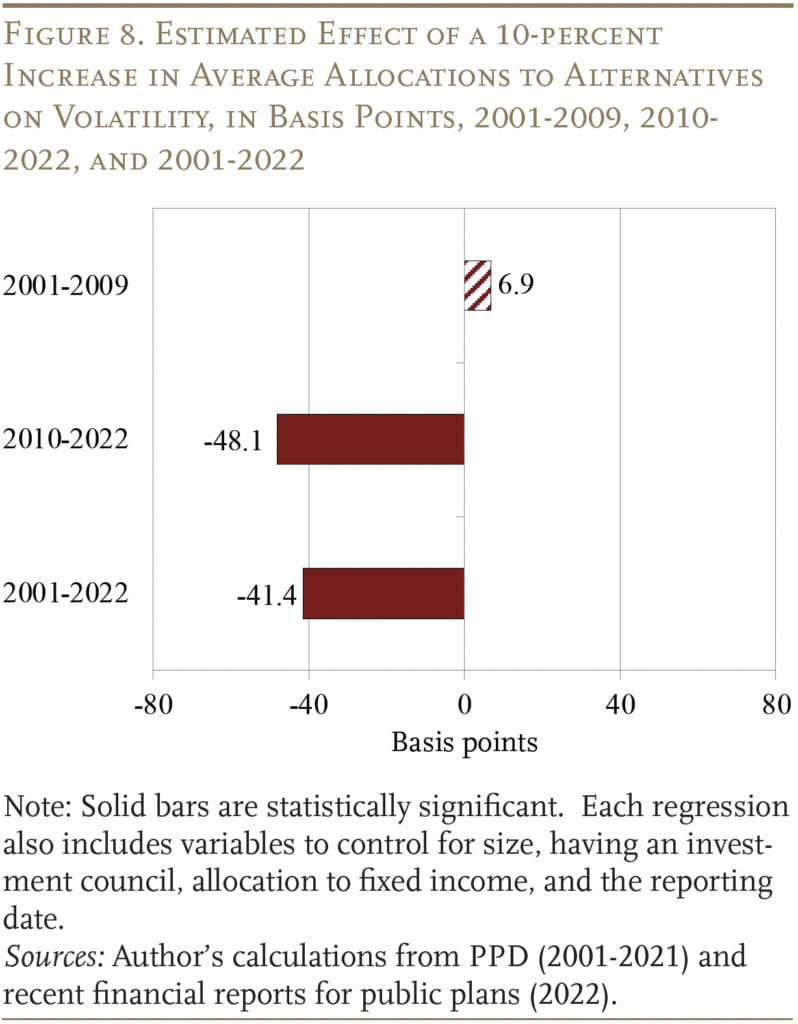
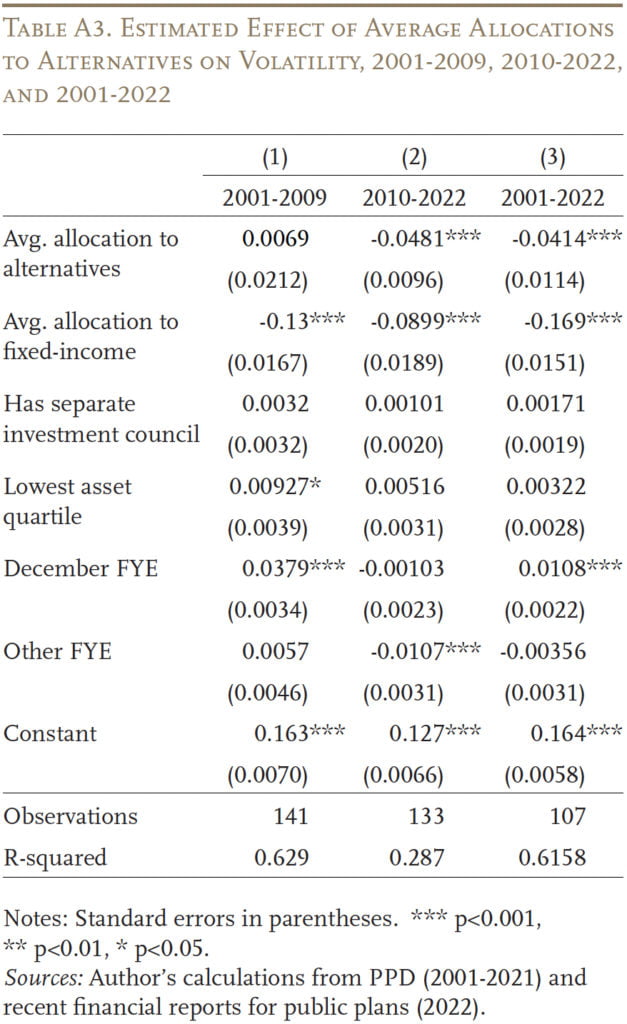
Pension funds care about more than investment returns over the long-run; a number of public plans cited reduced volatility as a rationale for investing in alternatives.11Sixty-two plans provided an explicit rationale in their Comprehensive Annual Financial Report for their movement into alternatives as they began to make the shift. The vast majority cited a desire for increased diversification, while eight plans mentioned lower equity exposure and nine mentioned volatility. Only one explicitly cited maximizing returns. Hence, the third regression relates holdings in alternatives to the volatility (i.e., the standard deviation) in reported annual pension fund returns. The results show that plans with greater overall allocations to alternatives have experienced lower volatility in their annual returns since 2010 and over the whole period since 2001 (see Figure 8).12See full results in Appendix Table A3. However, alternatives did not seem to have any effect on the volatility of reported annual returns during the pre-crisis period.
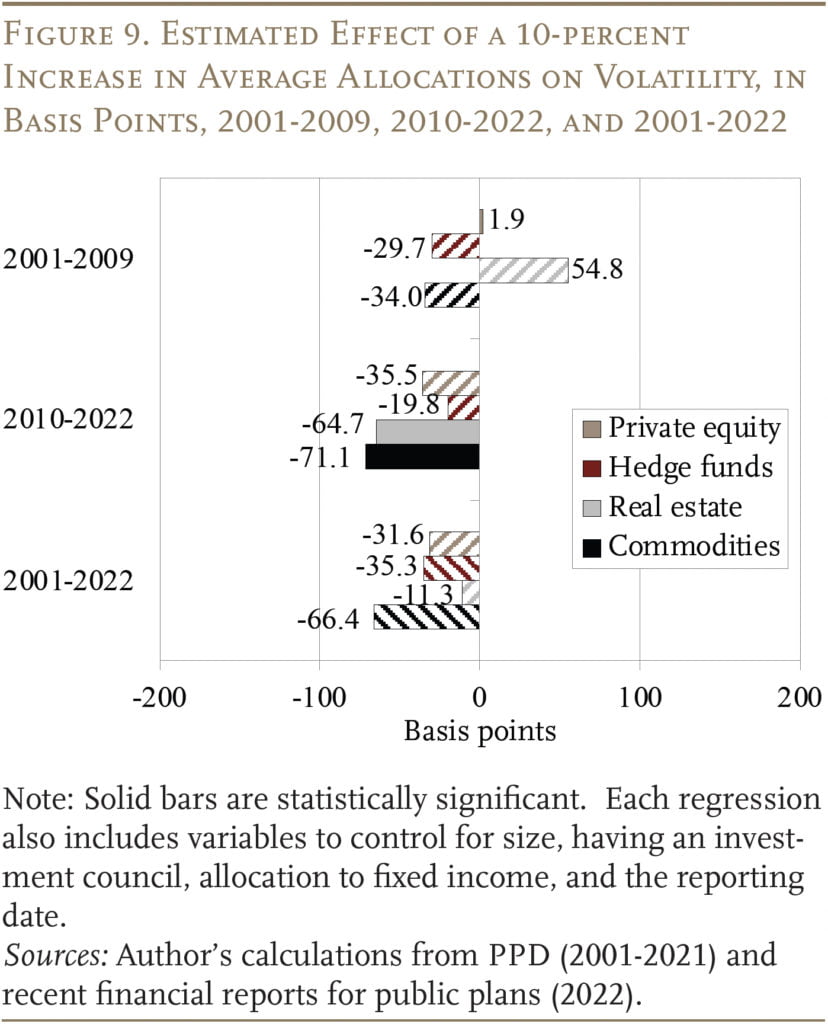
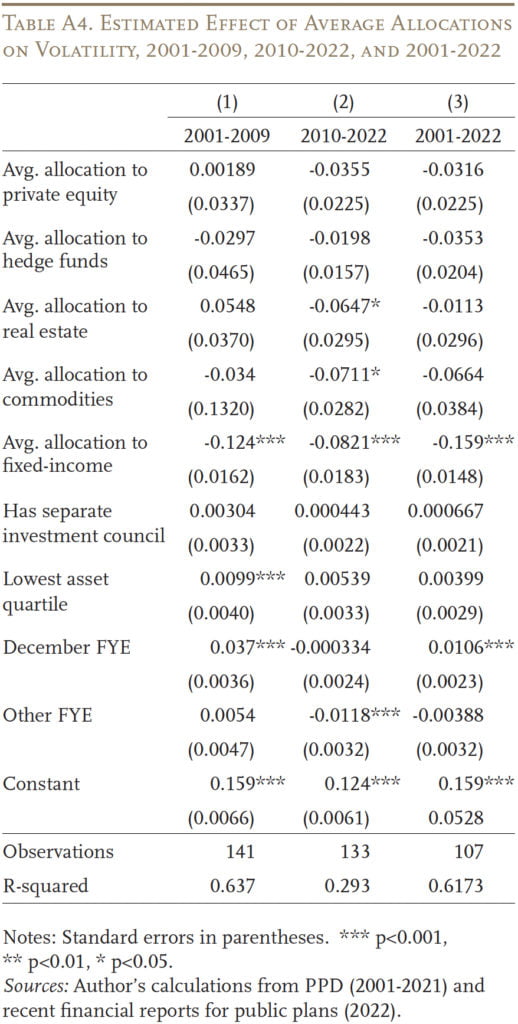
Finally, the fourth regression investigates the impact that specific alternative asset classes have had on portfolio volatility and suggests that real estate and commodities drove much of the overall effect observed over the post-crisis period. For the whole period, the regression suggests that each asset class contributed to a reduction in volatility – but that it is difficult to tease out the effect of one asset class from another (see Figure 9 on next page).13See full results in Appendix Table A4.
Overall, the analysis suggests that greater allocation to alternatives helped pension fund returns prior to the global financial crisis, but has harmed them since – with no significant impact when looking over both the pre-and post-crisis periods. Additionally, the reported data from pension funds suggest that greater holdings of alternatives have been associated with lower volatility in annual returns. Unfortunately, it is difficult to know how much of the reduction in the volatility is real rather than the product of lagged and imprecise valuations for some alternative assets.14Proponents of alternative investments often argue that the returns on many alternatives are uncorrelated with those in the stock market, so they can add diversification to a portfolio and help mitigate volatility – see Aberdeen Asset Management (2017). However, accounting delays and/or infrequent pricing can understate alternatives’ correlation with other asset classes in the portfolio – such as traditional equities – and, thus, overstate the power that alternatives have to reduce portfolio volatility.
Conclusion
Fiscal year 2022 was difficult for the investment performance of state and local pension plans, erasing much of the gains from 2021. Some have suggested that the losses would have been much greater if not for alternatives. To understand the role of alternatives, this brief assesses plans’ long-term investment performance – including losses in 2022. The analysis concludes that the investment performance of pension funds since 2001 has been below actuarial expectations and that plans’ increasing reliance on alternative investments has not helped – although it may have dampened volatility.
References
Aberdeen Asset Management. 2017. “Alternatives: Tools for a Diversified Portfolio.” SEG ALTS-WP. Philadelphia, PA.
Aubry, Jean-Pierre, Alicia H. Munnell, and Kevin Wandrei. 2019. “How Has the Decline in Assumed Returns Affected Plan Costs?” State and Local Plans Issue in Brief 66. Chestnut Hill, MA: Center for Retirement Research at Boston College.
Aubry, Jean-Pierre, Anqi Chen, and Alicia H. Munnell. 2017. “A First Look at Alternative Investments and Public Pensions.” State and Local Plans Issue in Brief 55. Chestnut Hill, MA: Center for Retirement Research at Boston College.
Fung, William, David Hsieh, Narayan Naik, and Tarun Ramadorai. 2008. “Hedge Funds: Performance, Risk, and Capital Formation.” The Journal of Finance 63(4): 1777-1803.
Gillers, Heather. 2022. “Market Rout Sends State and City Pension Funds to Worst Year Since 2009.” (August 9). New York, NY: Wall Street Journal.
Gillers, Heather and Dion Rabouin. 2022. “Pensions Brace for Private-Equity Losses.” (September 24). New York, NY: Wall Street Journal.
Ibbotson, Roger G., Peng Chen, and Kevin X. Zhu. 2011. “The ABCs of Hedge Funds: Alphas, Betas, and Costs.” Financial Analysts Journal 67(1): 15-25.
Ilmanen, Antti. 2012. “Expected Returns on Major Asset Classes.” Charlottesville, VA: The Research Foundation of CFA Institute.
Jacobius, Arleen. 2022. “Oregon Public Employees Powers to 6.3% Return on Strength of Private Equity.” (September 9). New York, NY: Pension & Investments.
Public Plans Database. 2001-2021. Center for Retirement Research at Boston College, MissionSquare Research Institute, National Association of State Retirement Administrators, and Government Finance Officers Association.
The Pew Charitable Trust. 2017. “State Public Pension Funds Increase Use of Complex Investments.” Washington, DC.
U.S. Census Bureau. Survey of Public Pensions: State & Local Data, 2000-2016. Washington, DC.
Appendix
Endnotes
- 1See Gillers (2022), Gillers and Rabouin (2022), and Jacobius (2022).
- 2The analyses in this brief are based on the Public Plans Database (PPD), which consists of roughly 220 major public pension plans (118 state and 100 local) that represent over 95 percent of total U.S. state and local pension assets and membership. In the PPD, roughly 75 percent of plans – representing 70 percent of the PPD assets – report fiscal year performance as of June 30, 25 percent of plans report as of December 31, and the remaining plans report as of the last day in either August, September, March, or April. The 26.7-percent return for FY 2021 reflects the 1-year return for plans that report fiscal year performance as of June 30. The FY 2021 performance for all PPD plans was 24.1 percent.
- 3The CRR obtained quarterly investment reports as of June 30, 2022 for about 170 PPD plans. Of these plans, about 110 report fiscal year performance as of June 30. The negative 5.5-percent return reflects the 1-year return as of June 30 for these 110 plans. The 1-year return as of June 30 for all 170 plans was negative 7.1 percent.
- 4Of course, the annualized return varies depending on the time period being assessed. Based on the PPD, the average annualized net-of-fee return over the last 10 and 15 years was 7.8 percent and 5.8 percent, respectively. And, based on the U.S. Census Bureau, the aggregate annualized net-of-fee return over the last 30 years was 8.6 percent (U.S. Census of Governments, 2022).
- 5Although plans have incrementally reduced their actuarially assumed return from about 8 percent in 2001 to about 7 percent in 2022, their cumulative realized returns over this period have fallen well short of actuarial expectations. Importantly, the decline in the assumed return has been mostly due to lower inflation and low interest rates. To offset this decline, plans have shifted away from fixed income and into riskier asset classes. By shifting into riskier assets, most plans have actually increased their real return assumption (that is, the expected return net of inflation). For an analysis of these trends, see Aubry, Munnell, and Wandrei (2019).
- 6The definition of alternative investments is somewhat fluid. For that reason, we define them by what they are not: they are not traditional stocks, bonds, and cash – held directly or in mutual funds. All other investments are classified as “alternatives.” For a broader discussion on alternative investments by public pensions, see Aubry, Chen, and Munnell (2017).
- 7Out of 160 PPD plans reviewed, 130 reported the performance of private assets with a quarter lag.
- 8These biases can have a large effect. Ibbotson, Chen, and Zhu (2011) found that accounting for survivorship and backfill bias in the average return for hedge funds reduced the return from 14.9 percent to 7.7 percent over the period 1995-2009. Of course, since these data represent averages, some individual funds may have had much better (or worse) returns. For a detailed overview of the different types of biases, see Ilmanen (2012).
- 9Specifically, the regression includes a flag for whether the plan is in the lowest asset quartile in the beginning of the period and flags for whether the plan’s most common fiscal year end date over the period is either June 30, December 31, or some other date.
- 10See full results in Appendix Table A2.
- 11Sixty-two plans provided an explicit rationale in their Comprehensive Annual Financial Report for their movement into alternatives as they began to make the shift. The vast majority cited a desire for increased diversification, while eight plans mentioned lower equity exposure and nine mentioned volatility. Only one explicitly cited maximizing returns.
- 12See full results in Appendix Table A3.
- 13See full results in Appendix Table A4.
- 14Proponents of alternative investments often argue that the returns on many alternatives are uncorrelated with those in the stock market, so they can add diversification to a portfolio and help mitigate volatility – see Aberdeen Asset Management (2017). However, accounting delays and/or infrequent pricing can understate alternatives’ correlation with other asset classes in the portfolio – such as traditional equities – and, thus, overstate the power that alternatives have to reduce portfolio volatility.


Aubry, Jean-Pierre. 2022. "Public Pension Investment Update: Have Alternatives Helped or Hurt?" Issue in Brief 22-20. Chestnut Hill, MA: Center for Retirement Research at Boston College.