February 2019
Affordable for Whom?
Comparing Affordability Levels of the Mayor’s Housing New York Plan With Neighborhood Incomes
PDF version available here.
Summary
Housing New York, the plan to construct 120,000 new affordable housing units and preserve 180,000 existing units over 12 years, is one of the signature initiatives of the de Blasio Administration. The plan is well underway, but there continues to be questions about the affordability of the housing for many lower-income New Yorkers and the locations where the housing is being built. These questions underscore concerns about whether the plan is providing housing opportunities equitably across the city, serving those most in need, or fueling gentrification.
IBO has examined the location of nearly 78,000 Housing New York units financed from January 2014 through June 2017 and compared their income restrictions with the “typical” income of neighborhood residents. Among our findings:
- Most of the housing financed over our study period is located in lower-income neighborhoods, where the typical neighborhood household qualifies either for very low or low income housing, based on the plan’s income definitions. Relatively few units are located in the city’s middle- and high-income neighborhoods.
- Just over half of the housing financed during the period is located in a neighborhood where the typical household earns too much to qualify for the affordable housing located there. While this means the typical household is not eligible for the housing, neighborhood households poorer than the typical household may qualify.
- Nearly a quarter of the units financed over the period are located in neighborhoods where the typical household does not earn enough to qualify for the housing.
- The remaining 25 percent of units financed during this period are located in neighborhoods where the typical household would meet the income-eligibility limits, although poorer residents in those neighborhoods would likely not earn enough to qualify.
- Units reserved for the lowest incomes are predominantly located in neighborhoods of similar or slightly higher relative incomes. Moderate-income units are mostly located in relatively poorer neighborhoods, while the majority of middle-income units are located in the city’s highest-income neighborhoods.
The report also examines how the five income levels the de Blasio Administration uses to determine eligibility—extremely low, very low, low, moderate, and middle—are formulated. IBO uses the Department of City Planning’s Neighborhood Tabulation Areas to define neighborhoods around a Housing New York project and U.S. Census American Community Survey data to calculate the neighborhood’s typical household income.
Background: Housing New York
In an effort to alleviate the strain of high housing costs on city residents, Mayor de Blasio continues to make the creation and preservation of affordable housing a signature issue of his administration. In 2014, the de Blasio Administration announced the Housing New York plan to finance 80,000 new units of affordable housing and 120,000 preserved units, for a total of 200,000 affordable units over 10 years. Citing progress towards the city’s goals, the Mayor revised the plan in the 2017; Housing New York 2.0 has an expanded goal of financing 300,000 units over 12 years—120,000 new units and 180,000 preserved units. Affordable housing is preserved when the city extends the duration of affordability requirements for existing housing or enters into new agreements to ensure affordability, usually in exchange for financing benefits and tax breaks.
Since Mayor de Blasio took office in January 2014 through the end of fiscal year 2018 last June, the city has financed almost 110,000 affordable homes with $4.4 billion in direct city investment and $8.5 billion in low-cost bond financing, as well as tax expenditures. This housing is reserved for households that fall within five income bands defined in the city’s housing plan—extremely low income, very low income, low income, moderate income, and middle income.
Although the city is on track to finance housing at a scale unprecedented in its history, advocates and elected leaders have questioned where this housing is being located and for whom it is priced. A prominent concern is whether housing is reserved for household incomes that would allow local residents to qualify. This question ties into larger debates around the equitable distribution of affordable housing across the city, gentrification of city neighborhoods, and affordable housing lottery priority for local residents.
In this brief, IBO examines where the Housing New York units are located and how income restrictions on this housing compare with incomes in the surrounding neighborhoods. First, we consider the policy implications of financing affordable housing for households with incomes lower, higher, and similar to the incomes of the local neighborhood. We then explain how affordable housing income bands used in the housing plan are defined. Using data from the U.S. Census Bureau’s American Community Survey (ACS), IBO estimates the income of the typical household in each neighborhood in order to determine the income band for which the household would qualify (if any). Lastly, we quantify how many units the city has financed at income levels at, below, and above the income band for which the typical household in the surrounding neighborhood would be eligible.
Competing Considerations: Locating Affordable Housing In Neighborhoods of Similar, Lower, and Higher Incomes
The city faces numerous and occasionally conflicting policy considerations in financing affordable housing for households with incomes at, below, and above the incomes of the surrounding neighborhood. Financing housing that is reserved for the income level of current area residents may allow them to remain in their neighborhood and maintain social ties and other supports they have established in the community. This is especially germane in neighborhoods with rapidly changing housing prices. Under current city practice (although currently being challenged in court), 50 percent of new affordable units are reserved for residents of the corresponding community district. In order for local residents to benefit from this preference, however, their income must fall within the income bands set for the housing. Yet financing housing exclusively for households with incomes representative of the local community and giving those residents preference brings up criticisms of perpetuating income, racial, and ethnic segregation.1
In contrast, financing affordable housing reserved for households with lower incomes relative to the neighborhood allows lower-income households an opportunity to move to higher-income areas, which typically have more expensive market rents. Such neighborhoods are less likely to have market-rate rents that a lower-income household could afford.
A growing body of research demonstrates that neighborhoods matter—that where people live, especially children, can impact future educational and employment outcomes.2 Higher-income neighborhoods in the city tend to have lower rates of violent crime and better public services, making them more desirable places to live. Also, city schools that have greater concentrations of students from higher-income neighborhoods tend to have higher average standardized test scores and graduation rates. In higher-income neighborhoods, however, developable land and construction tend to cost more, particularly in large swaths of Manhattan and North Brooklyn.3 Higher per unit costs may ultimately result in fewer units being financed.
Financing units, such as middle- and moderate-income housing, reserved for higher-income households in neighborhoods of lower incomes provides investment to neighborhoods that may historically have experienced disinvestment; improvements in the housing stock may help to stabilize and revitalize a neighborhood and address blight. In addition, higher income affordable housing units pay more in rent than units reserved for lower-income households, allowing for higher-rent units to cross-subsidize other units in the building to reach deeper levels of affordability. Nevertheless, setting aside affordable housing for higher-income households may be seen as encouraging wealthier residents to move into the neighborhood more generally, encouraging gentrification, and potentially changing the existing neighborhood character. Moreover, affordable housing prices may not be that different from market rates in the area, and these higher-income households generally have more housing choices available to them. This can lead to low take-up rates for higher-income affordable units located in lower-income areas.
Keeping these competing policy choices in mind, we look at income eligibility for affordable housing under the de Blasio Administration’s Housing New York plan.
How Affordable Housing Income Bands Are Established
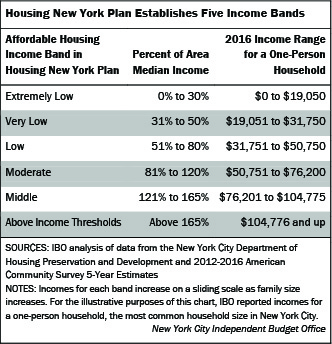
In order to be eligible for affordable housing, prospective households must fall within specific income bands; each band has a minimum and a maximum income requirement. The five income bands used in the Housing New York plan are extremely low, very low, low, moderate, and middle income. Rents (or sale prices) are set depending on the specific income range and household size for which a unit is reserved. When affordable housing is financed, the underwriting takes these rents into account.
The calculations to set these bands are done in two stages across two levels of government. The federal Department of Housing and Urban Development (HUD) sets an Area Median Income (AMI) and then the city establishes income bands as a percentage of that AMI. HUD’s calculation tends to overstate AMI compared with the census estimates of median income of city residents because of an adjustment HUD makes to take New York City’s high rental burdens into account. Although HUD’s AMI calculation is a common metric from which to set affordable housing income bands, there is no requirement for how the city uses AMI to set its income bands, or that that the city define its housing plan in terms of AMI at all. In the end, it is up to the city to determine what income levels its housing program serves.
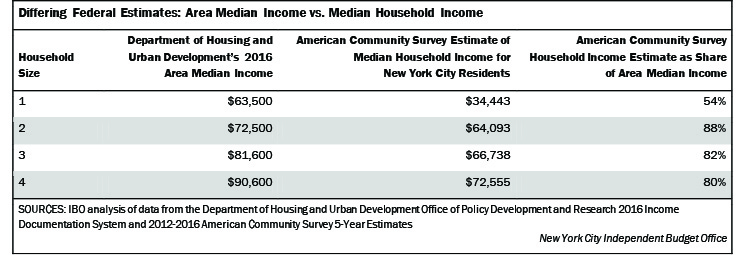
HUD’s AMI Higher Than Census Median Income. HUD’s calculation of AMI is more complex than simply reporting the median household income for all city residents. To calculate the AMI used for New York City, HUD first uses Census data from the five boroughs, Putnam, Rockland, and Westchester counties to determine the median family income for the “New York HUD Metro Fair Market Area.”4 According to the Census Bureau, these three neighboring counties have higher median family incomes than the city—$115,978, $101,100, and $113,190 compared with $61,343, respectively. HUD also bases its calculation of AMI on median incomes of families rather than households. This excludes the incomes of single people living alone or households of unrelated adults. In general, family incomes are higher than household incomes. These calculations result in an initial 2016 AMI of $65,200 for a family of four in New York City.5
Much attention has been paid to the inclusion of nearby counties and use of family income in HUD’s calculations, as they increase the initial AMI estimate. For the resulting AMI, however, these methodological choices are rendered moot by HUD’s use of the “High Housing Cost Adjustment.” The logic underpinning this adjustment is that in areas of the country where housing costs are high, the pool of households eligible for affordable housing should be expanded. One way to expand the pool is by increasing the AMI level, by which affordable housing income limits are often set. HUD’s adjustment is based on whether a four-person, very low income household (defined as a household earning half of HUD’s initial AMI estimate) can afford a two-bedroom apartment at local rates. If the answer is no, HUD increases the income limit for a very low-income household to a level it deems would make a two-bedroom rental affordable. This calculation then serves as a benchmark from which AMI is scaled. Through this adjustment the HUD AMI for a family of four, for example, increases from $65,200 to $90,600.6 HUD’s AMI, therefore, ultimately reflects the high cost of housing and not the incomes of city residents.
In a comparison of HUD’s AMI calculations and the Census Bureau’s American Community Survey estimates of median income for a New York City household of the same size, the HUD figures consistently come out higher. HUD’s AMI for a two-person household is closest to the ACS estimate of median income, $72,500 compared with $64,093, respectively. The difference is greatest for a one-person household, $63,500 (HUD) compared with $34,443 (ACS). A large part of this difference can be attributed to how HUD adjusts the AMI for a family of four down or up to calculate AMI for smaller and larger household sizes. For example, HUD sets a one-person AMI as 70 percent of the four-person AMI (with some rounding adjustments)—noticeably different from the ACS median-income data that suggests the median income of a one-person household is 47 percent of that for a four-person household.
City Uses Percentages of Area Median Income. How the HUD AMI translates to prices of affordable housing is rooted in city policy choices. The five affordable housing income bands set by the city are calculated as a percentage of the HUD AMI. Mayoral administrations have defined the bands in different ways. For example, under former Mayor Bloomberg’s New Housing Marketplace Plan, middle income was defined as from 121 percent of AMI through 180 percent of AMI, while under Mayor de Blasio’s Housing New York plan, middle income is defined as 121 percent of AMI to 165 percent of AMI.
For some housing programs, income limits are determined by federal or state funding sources. For example, projects using federal HOME funds are generally reserved for what it defines as “low income families” making up to 60 percent of AMI, in contrast to the city’s definition of low income that maxes out at 80 percent of AMI. In general, however, it is largely up to the city to decide how it defines income bands and how much housing to produce—given limited resources for subsidies—for each band.
Income Limits and Local Median Prices
In order to determine how the income bands used in the Mayor’s housing plan compare with local incomes, IBO assigned each neighborhood in the city to the level of affordable housing for which the typical neighborhood household would qualify (if any). We used the 195 Department of City Planning Neighborhood Tabulation Areas (NTA), which are created from clusters of the city’s census tracts to approximate city neighborhoods.7 IBO calculated the income of a “typical neighborhood household” using the 2012-2016 5-year census tract-level estimates from the American Community Survey. Because income limits for each affordable housing band depends on household size, IBO first found the median household size for each neighborhood. We then used the weighted average of the median census tract incomes for households of that size to determine the “typical income” for households of that size. The incomes of typical neighborhood households were then compared to the 2016 affordable housing income ranges to assign each neighborhood to an affordable housing income tier.8
IBO found that in the overwhelming majority of city neighborhoods, the typical household qualifies for some level of affordable housing as defined under the Mayor’s housing program. In only 4 percent of neighborhoods does the typical household earn too much to qualify for some level of affordable housing under Housing New York.
Not surprisingly, eligibility for affordable housing income bands is not evenly distributed across the city. Nearly all the neighborhoods where the typical household qualifies for extremely low and very low income housing are located in the Bronx. Neighborhoods with a typical household income over the affordable housing income limits are located in large parts of Manhattan and the Brooklyn and Queens East River waterfronts.
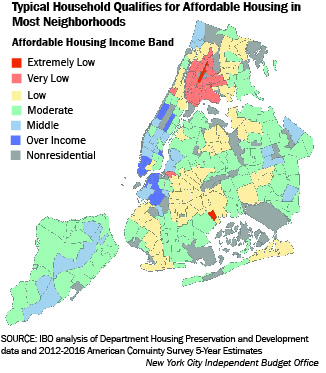
In Most Neighborhoods, Typical Household Qualifies for Moderate- or Low-Income Housing. IBO found that the largest share of neighborhoods (43 percent) has a typical household that qualifies for moderate-income housing. This is followed by neighborhoods where the typical household qualifies for low-income housing (30 percent). The smallest share, 1 percent of neighborhoods, has a typical household that would be eligible for extremely low income affordable housing, the lowest income band. At the other end of the income spectrum, in 4 percent of neighborhoods, the typical household earns too much to qualify for affordable housing under the city’s current housing plan.
In comparing the housing plan goals with the overall progress to date, IBO found that the city is prioritzing the financing of affordable housing for the lowest income bands—extremely low, very low, and low income.
While the largest share of typical neighborhood households would qualify for moderate-income housing, the city’s goal is to reserve 10 percent of units for moderate-income households; thus far, 6 percent of units financed are for moderate-income residents. The city has a similar goal for middle-income units (10 percent of the total plan). IBO found, however, that far fewer neighborhoods have a typical household that is middle income (12 percent) compared with moderate income (43 percent).
Low-income housing has the largest financing goal under the plan, 56 percent and represents 45 percent of what has been financed through June 2018. In contrast, only 30 percent of neighborhoods have a typical household that qualifies for low-income housing.
IBO classified a total of 11 percent of neighborhoods as extremely low or very low income. While the city aims to have 25 percent of all units to serve these incomes, 39 percent of units financed through June 2018 have been for these lowest incomes. This makes sense if a goal of the housing program is to create more housing for the populations that have the greatest need. Research suggests the need is concentrated among the poorest households, particularly those that are extremely and very low income.9 But only about 30 percent of the nearly 25,000 units affordable to the two lowest income groups are new constuction projects. In other words, most of the units that have been financed for the lowest income groups are already occupied and far fewer are units that are or will become newly available housing.
Comparing Affordable Housing Income Restrictions With Neighborhood Household Incomes
In the preceding section, IBO examined what type of affordable housing New Yorkers living in different parts of the city qualify for and looked at how much housing at each affordability level the city has financed thus far. But a crucial question remains to be answered: how do the income restrictions of the housing the city has built or preserved under Housing New York compare with the incomes of households living in the surrounding neighborhoods? The city’s Housing New York plan sets goals for the incomes its affordable housing will serve but does not specify the neighborhoods in which affordable housing is located. Policy goals behind the creation and preservation of affordable housing, however, include efforts to keep families in their neighborhoods by keeping existing rents stable or by creating affordable housing for households in areas where rising rents may price out current residents.
In order to compare each Housing New York unit’s affordability level to its surrounding neighborhood, IBO mapped where Housing New York units have been financed thus far. (Click here for maps and information on the geographic distributions.) The data set consisted of 77,686 housing units in 2,128 buildings financed from January 2014 through June 2017.10 These figures exclude homeownership units that had their geographic location redacted by HPD for privacy reasons and units intended for building superintendents and other management staff.11 We geocoded the affordable housing units in our data set to compare each neighborhood’s income with the income restrictions on the affordable housing built or preserved in that neighborhood.
Most Affordable Housing Located Where Typical Household Qualifies for Very Low and Low Income Housing. In examining where affordable housing has been financed, IBO found that nearly two-thirds of all units are located in neighborhoods where the typical household qualifies for very low and low income housing (25 percent and 37 percent, respectively). Only 1 percent of units are located in neighborhoods where the typical household qualifies for extremely low income housing; very few neighborhoods, however, have a typical household poor enough to be eligible for extremely low income housing.
Far fewer units are located in neighborhoods where the typical household qualifies for housing on the higher end of the affordable-housing spectrum—18 percent of units are located in neighborhoods where the typical household is eligible for moderate-income housing and 10 percent where the typical household is eligible for middle-income housing. Finally, 9 percent of affordable units are located in neighborhoods with a typical household that is over income for any level of affordable housing. Most of these affordable units are either low income new construction units created through the inclusionary housing program or existing middle-income units that extend affordability requirements through preservation.
Over Half of Units Located Where Typical Household Earns Too Much to Qualify. IBO found that overall the largest share of HNY units financed, 51 percent, are located in neighborhoods where the typical household earns too much to qualify for the income restrictions of the project. While this means the typical neighborhood household is not eligible for the housing, it also means that households poorer than the typical household in these neighborhoods may qualify for the affordable units. A total of 25 percent of units are reserved for an income band for which the typical neighborhood household qualifies, although this means some households poorer than is typical for the neighborhood may not earn enough to qualify. The remaining 24 percent are reserved for households with incomes higher than the band for which the typical household currently living in the neighborhood qualifies.
IBO found little difference between new construction and preservation units financed when comparing the income restrictions of the projects with the incomes in the neighborhoods. Just over half of new construction units, 52 percent, are reserved for households with incomes below the income band of the typical household living in the neighborhood. A similar 51 percent of preservation units are for households poorer than the typical neighborhood household. Somewhat more preservation units are for the income band that the typical neighborhood household is eligible for (26 percent) compared with newly constructed units (22 percent). Conversely, somewhat more new construction units are reserved for households with incomes above that of the typical neighborhood household (27 percent) compared with preserved units (23 percent).
Most Extremely Low and Very Low Income Units Located in Neighborhoods with Higher Incomes. IBO further examined how housing financed at each of the specific income bands in the Mayor’s housing plan compared with the incomes of neighborhoods where they are located. There are only two neighborhoods in the city where the typical household qualifies for extremely low income affordable housing. Therefore it is not surprising that only 1 percent of the 11,478 extremely low income units in our study are located in extremely low income neighborhoods. The remaining extremely low income units are located in neighborhoods where the typical household earns too much to qualify for the housing; nevertheless, poorer households in those neighborhoods may qualify. The largest share of extremely low income units (34 percent) are located in neighborhoods where the typical household qualifies for the very low income band—one income band above extremely low. Extremely low income units located in neighborhoods where the typical household qualifies for the highest affordable housing income bands, moderate- or middle-income housing, respectively make up 25 percent and 11 percent of all extremely low income units. In these neighborhoods, few opportunities for housing affordable for the poorest New Yorkers are likely to exist outside the housing plan.
For the very low income band the largest share of units—71 percent of the 13,258 very low income units in the study—are also located in neighborhoods where the income of the typical household is higher than the very low income band restrictions. The largest share of very low income units (44 percent) are located in neighborhoods where the typical household would qualify for low-income housing, one income band above very low. Of the remaining units, 28 percent are located in neighborhoods where the typical household qualifies for very low income housing, and 1 percent of units are located in neighborhoods where the typical household falls into the extremely low income band.
Low-Income Housing Most Evenly Distributed Among Neighborhoods of Higher and Lower Income Bands. Low income affordable housing is the most evenly distributed among neighborhoods: 29 percent of low-income units are located in neighborhoods where the typical household’s income is lower, 37 percent are located in neighborhoods where the income of the typical household is similar, and 34 percent are in neighborhoods where the typical household’s income is higher. With 37,744 low-income units in our study, low income is also the most common income band for affordable housing financing. Aside from the 37 percent of low-income units located in neighborhoods where the typical household has a similar income, most of the other low-income units are located in neighborhoods where the typical household income is one band away—28 percent in very low income neighborhoods and 19 percent in moderate-income neighborhoods. Only 4 percent of low-income units are located in neighborhoods where the typical household income would be too high to qualify for any affordable housing.
Moderate-Income Units Mostly in Lower-Income Neighborhoods, Middle-Income Units Mostly in Higher-Income Neighborhoods. Moderate income housing units are most concentrated in neighborhoods with lower incomes. A total of 81 percent of the 5,103 moderate-income units in our study are located in neighborhoods where the typical household living in the neighborhood does not earn enough to qualify for the housing. Of those, the majority of moderate income housing units are in low-income neighborhoods (59 percent). Only 7 percent of moderate-income units are in neighborhoods where the typical household is eligible for moderate-income housing. The remaining 12 percent are in neighborhoods where the typical household is middle income; no moderate-income units are located in areas where the typical household income would be too high to qualify for affordable housing.
As for the highest income band of affordable housing, 53 percent of the 9,718 middle-income units are located in neighborhoods where the typical household exceeds the income limits set in the Housing New York plan. Another 9 percent of middle-income units are located in neighborhoods where the typical household is also middle income. The remaining 38 percent are in neighborhoods where the typical household does not have a high enough income to qualify for middle-income housing.
Almost All Very Low and Low Income Neighborhoods Have Housing Reserved for Incomes Mirroring the Typical Neighborhood Household. In addition to looking at how the income bands for affordable units compare with the income of a typical household of the neighborhood where the housing is located, IBO also examined how many neighborhoods within each income band have units reserved for households of that income level. All but four of the 76 very low and low income neighborhoods (95 percent) have affordable housing financed for households at a similar income level. In contrast, only 44 percent of the neighborhoods where the typical household is moderate income (35 out of 80) have moderate-income housing financed. Middle-income units, meanwhile, are found in around two-thirds of the city’s middle-income-qualifying neighborhoods. Put differently, middle-income neighborhoods have a greater likelihood of having middle-income housing financed in their area than moderate-income neighborhoods of having moderate-income housing financed in their area.
Balancing Priorities
Understanding the relationship between the income restrictions on the affordable housing the city is financing and the incomes of the surrounding community is important, especially as it relates to discussions about the equitable distribution of affordable housing across the city, local resident preferences for affordable housing, and gentrification of city neighborhoods.
In terms of the distribution of housing, IBO found that most of what the city has financed thus far is located in the city’s lower-income neighborhoods, where the typical household qualifies either for very low or low income housing according to the Mayor’s income definitions. Far fewer units are located in the city’s higher-income neighborhoods. While this may further the concentration of poverty, it may also translate into more affordable housing overall because it is often less expensive to finance housing in communities where housing costs are lower.
Along with the fact that housing is mostly located in lower-income communities, IBO found that when it comes to the relationship between each housing unit and its surrounding neighborhood, just over half (51 percent) of the housing financed by the city is located in a neighborhood where the typical household earns too much to be eligible for the housing. This is because although the units financed thus far are largely reserved for households in the low and very low income bands, most of these units are located in communities that fall into slightly higher categories of income. It follows, however, that the poorer households in those communities may be eligible for these housing opportunities.
Financing housing at income levels too expensive for current residents has been a prominent concern of advocacy groups and community organizers, and IBO found some evidence of this—24 percent of units financed thus far are located in neighborhoods where the typical household is too poor to qualify for the housing. For example, the overwhelming majority of moderate-income housing the city has financed thus far is located in neighborhoods where the typical household earns too little to qualify. The remaining 25 percent of units are located in neighborhoods where the typical household would qualify for the housing, although households poorer than those typical to the neighborhood likely would not earn enough to be eligible.
The city has multiple goals in terms of how income restrictions of the housing it finances compares with local incomes. For example, the current 50 percent lottery preference to local community board residents means that at some level the city has a goal to reserve housing for current residents. Under both Voluntary and (now) Mandatory Inclusionary Housing, affordable units are set aside generally within an otherwise market-rate building in exchange for the right to build a larger building than traditional zoning would allow. This encourages the development of affordable housing for lower-income households in neighborhoods whose residents have incomes that are generally higher. As IBO outlined at the beginning of this paper, there are also benefits to locating relatively higher-income housing in areas of lower incomes, although this fuels concerns of gentrification.
Varied and sometimes changing housing policies, intertwined with the Housing New York plan’s goal of developing and preserving 300,000 affordable units, put questions of for whom these units will serve to the forefront. As HNY progresses, questions surrounding the geographic distribution of affordable housing and the distribution of income levels the housing is designed to serve will remain relevant.
Prepared by Sarah Stefanski
Endnotes
1Another concern regarding community preference is that the city’s community districts are relatively large and span areas much larger than what city residents would consider a single neighborhood. As a result, the 50 percent reservation can reward people with no connection to the immediate neighborhood where an affordable project is located.2For a starting place on the literature connecting neighborhoods of residence to long-term economic outcomes, see Chetty, Raj, Nathaniel Hendren, & Lawrence Katz. “The Effects of Exposure to Better Neighborhoods on Children: New Evidence from the Moving to Opportunity Project.” American Economic Review 106, no. 4 (2016): 855-902.
3For information on how locations across New York City impact construction costs of affordable housing, see IBO’s February 2016 report “The Impact of Prevailing Wage Requirements on Affordable Housing Construction Costs in New York City.”
4HUD’s “New York HUD Metro Fair Market Area” income calculations include the five boroughs and three upstate counties in the income calculation, but the resulting AMI is only applied to the five boroughs of New York City and Putnam County. Separately, HUD calculates county-specific AMIs for both Rockland and Westchester Counties.
5Calculating the 2016 AMI, HUD does not use the most recent U.S. Census Bureau American Community Survey data. HUD instead uses the median family income from the 2009-2013 ACS 5-year estimates ($63,373), adjusted into 2016 dollars using the Congressional Budget Office forecast of the national consumer price index, and rounded to the nearest $100. The 2012-2016 ACS 5-year estimates are the most recent 5-year estimates available. As such, IBO uses 2016 dollars and 2016 affordable housing income bands in this report.
6A detailed explanation of the High Housing Cost Adjustment can be found at FY 2016 Very Low-Income (50%) Income Limits Calculation.
7IBO performed this analysis at the Neighborhood Tabulation Area level of geography, after alternatively considering both census tract and community district geographies. While census tracts provided the most granular level of data, IBO had concerns about the margins of error for some tract-level estimates. Community districts, using Public Use Microdata Areas census data as a proxy, would allow for greater data flexibility but were found to be much larger than what readers would consider as “neighborhoods.” As NTAs are aggregates of census tracts, the increased number of observations decrease the margin of error while approximately corresponding to New York City neighborhoods—a smaller level of geography by about 3:1 when compared with community districts.
8IBO uses median household income and size for our typical neighborhood household calculation. IBO uses household-level data rather than the more restrictive family-level data for several reasons. First, the city’s Department of Housing Preservation and Development guidelines for households applying for affordable housing allow for relationships of financial and emotional interdependence that are less restrictive than the Census Bureau’s strict related-by-blood-or-marriage family definition. Additionally, since families are a subset of households, the household estimates have a larger sample size which reduces the margin of error.
9A 2017 report by the Association for Neighborhood and Housing Development (ANHD) looked at the income bands of HNY units, and how they compare with the incomes of rent-burdened households (defined as paying more than 30 percent of household income on rent). ANHD found that households qualifying for the lowest-income bands—extremely low- and very low-income—experienced the highest rates of rent burden. Under HNY, the share of units reserved for these lowest-income bands is lower than the share of rent-burdened households in these income bands. See Goldstein, Emily & Melanie Breault. (2017. September 13). “How Does Housing New York Measure Up to New Yorkers’ Needs?” Association for Neighborhood & Housing Development.
10At the time of this analysis, building-level data for 2018 was not yet available from HPD but aggregate-level reporting was.
11We were unable to include a total of 144 buildings containing 255 homeownership units in our study due to HPD redacting location information citing privacy reasons. An additional 385 units within affordable housing buildings that are not specifically reserved for an income-tested household but are intended for building supervisors or other management staff were also excluded.
PDF version available here.
Receive notification of free reports by e-mail