
Abstract
The decline of many wild bee species has major consequences for pollination in natural and agro-ecosystems. One hypothesized cause of the declines is pesticide use; neonicotinoids and pyrethroids in particular have been shown to have pernicious effects in laboratory and field experiments, and have been linked to population declines in a few focal species. We used aggregated museum records, ecological surveys and community science data from across the contiguous United States, including 178,589 unique observations from 1,081 bee species (33% of species with records in the United States) across six families, to model species occupancy from 1995 to 2015 with linked land use data. While there are numerous causes of bee declines, we discovered that the negative effects of pesticides are widespread; the increase in neonicotinoid and pyrethroid use is a major driver of changes in occupancy across hundreds of wild bee species. In some groups, high pesticide use contributes to a 43.3% decrease in the probability that a species occurs at a site. These results suggest that mechanisms that reduce pesticide use (such as integrative pest management) can potentially facilitate pollination conservation.
Main
There are widespread reports of bee declines in Europe and North America, but the status of most species is poorly known1,2,3,4,5,6. Insect pollination, largely from wild and managed bees, benefits ~75% of crop species worldwide and 88% of flowering plant species1. Further, the majority of crop pollination is provided by wild pollinators worldwide, and wild pollinators can enhance yields regardless of managed bee abundances7,8. Overall, this suggests that the decline of wild pollinators will have strong detrimental effects on pollination services, with both economic and ecological consequences.
The major drivers of wild bee declines include climate change5, land use change and habitat loss9, disease and pathogens10, dietary stress, and pesticide use9,11. Many of these factors are primarily associated with agricultural intensification (Extended Data Fig. 1)12. First, agricultural intensification generally reduces the diversity of floral and nesting resources available13. This is particularly the case in crop monocultures that do not provide resources to pollinators, such as grain monocultures14. Second, agricultural intensification can increase the exposure of wild bees to combinations of pesticides15. Among these pesticides, two notable classes are neonicotinoids and pyrethroids. The usage of these compounds is widespread across the United States, with neonicotinoid usage having rapidly increased since their introduction in the mid-1990s (Supplementary Figs. 1–3), while the usage of other classes of insecticides declined over the same time period (Extended Data Fig. 2)16. Evidence from both laboratory and field experiments has demonstrated that both types of pesticide are harmful to individual bees; thus, exposure to the high quantities typically used in agriculture could potentially cause population declines17,18,19. Neonicotinoids are a class of neuro-active insecticides that target the central nervous system20. They are either sprayed or applied as soil drenches or seed treatments. When used as a seed treatment, they are systemic, expressed throughout plant tissues including pollen and nectar. The effects of neonicotinoids are typically sublethal and chronic, and therefore difficult to detect under typical regulatory studies21. Because of their chronic and sublethal effects, the European Union banned neonicotinoids in 2018 (with a moratorium since 2013)22. Pyrethroids are synthetic, modified versions of pyrethrins and target the closure of voltage-gated sodium channels in axonal membranes of insects23. Lastly, many farmers, especially those with large acreages of crops that rely or benefit from animal pollination, use managed honeybees (Apis mellifera) for crop pollination. There is evidence that managed honeybees can negatively impact wild bees through competition for floral resources and disease transmission24.
While there are multiple avenues by which agricultural intensification might harm wild bee populations, identifying mechanistic pathways has been difficult. This is partly owing to large data gaps25,26, even in relatively well-sampled areas such as the United States. Similarly, lack of available data on historical application of different pesticides (both spatial and temporal) has hindered our ability to evaluate their full effects on communities. Indeed, most of the evidence that links pesticide use to bee declines comes from experimental or small-scale observational studies which may not reflect large-scale (for example, continent-wide) patterns. The majority of these studies were performed on a handful of species27 (most notably the western honeybee Apis mellifera) and therefore may not be representative of the many other wild bee species. However, recent studies from the United Kingdom have demonstrated that population-level extinction rates at a country level are associated with the use of neonicotinoid seed treatment11. Developing effective policies to protect wild bees requires understanding the causes of decline, and many of the purported causal factors are interlinked. Understanding the impacts of pesticides in relation to other potential drivers of decline is critical to sustainable management of ecosystems and food systems, and has important ecological and economic implications worldwide.
Here we address these challenges using one of the largest databases of bee records for the contiguous United States ever compiled; these were aggregated from museum specimens, surveys and community science observations25. The United States has the largest number of described bee species on the planet with 3,594 species (including Hawaii and Alaska)26, 17% of known species, and a large proportion of agriculture is intensive agriculture with recent land use change, making it an ideal place to understand the impacts of intensive agriculture on bee diversity. Our analysis included occurrence records for 1,081 bee species across the following families: 220 species from Andrenidae, 284 from Apidae (excluding Apis mellifera), 69 from Colletidae, 221 from Halictidae, 278 from Megachilidae and 9 from Melittidae (Fig. 1d). We combined multispecies occupancy models with tools of causal inference to estimate the effect of (1) pesticide use, (2) animal-pollinated agriculture (that is, agriculture that benefits from animal pollination) and (3) honeybee colonies on wild bee distributions across the contiguous United States. We did this via three types of multispecies occupancy model, each run independently on each bee family. We focused our analysis on crops that benefit from animal pollination because farms growing these may import honeybee colonies which may change their impacts on wild bees (Supplementary Fig. 4a vs b). Further, we expect that crops that benefit from animal pollination can provide additional resources known to attract wild bees. Finally, our analysis focuses specifically on the effects of neonicotinoids and pyrethroids because these classes of insecticides are thought to be linked to declines of wild pollinators1, and increasing use of these compounds has increased risk to bees16.

a, The distributions of pesticide use (2013–2015), modified from ref. 65. Pesticide use was calculated by dividing the kg of compound used by the LD50 (for honeybees), averaged over a 3-year period, summed across compounds and standardized to county area. b, Animal-pollinated agriculture (2008), modified from ref. 33. The percent of the county that is animal pollinated removes the following crops: corn, wheat, rice, soybean, sorghum, barley and oat. Here we include all crops that would present a high exposure to pesticides for wild bees. c, Honeybee colonies (2012), modified from ref. 51. The number of honeybee colonies comes from the Census of Agriculture of farms that sell more than US$1,000. Values for a–c are log transformed and scaled. d, Expected wild bee species richness. Wild bee expected richness was compiled from ref. 25 and divided by area of the county and log transformed (raw expected richness is presented in Supplementary Fig. 8).
We analyse individual species’ occupancy trends through space and time using a multispecies framework. In these models, individual species’ effects are drawn from distributions whose parameters are informed by data from all species. We analyse by family to reduce the computational burden. In addition, different families analysed separately provide semi-independent validation and, furthermore, bee species’ responses may be taxonomically grouped. We combined Melittidae and Colletidae (the two smallest families) because Melittidae had too few species to model on its own. In total, we ran 15 multispecies occupancy models (5 family groups × 3 effects). We modelled occupancy across all of the counties that fall within a species geographic range for 7 time periods, each lasting 3 years, from 1995 to 2015. We terminated in 2015 because the USGS Pesticide National Synthesis Project does not provide data on seed-coated neonicotinoids beyond 201528. We treated each of the 3 years within each time period as an opportunity for a potential visit by someone collecting bees. For each of these potential visits, we inferred species absences for a particular species at a site if another species within the same genus was observed at that site in that year4,29,30. We obtained data on pesticide use application for every county and every year from the USGS Pesticide National Synthesis Project31 (Fig. 1a). Because the application of neonicotinoids and pyrethroids are correlated across space and time, we aggregated all active compounds (for both neonicotinoids and pyrethroids), controlling for their toxicity by weighting each by its median lethal dose (LD50) as measured on honey bees (from the US Environmental Protection Agency (EPA) ECOTOX Database32). In doing this, we are implicitly assuming that the relative LD50 of different pesticides for honey bees is representative of the relative LD50 of those same pesticides for native bees, but we recognize that LD50s probably vary among wild bee species. We obtained honeybee colony data (the number of colonies per county across multiple years) from the National Agricultural Statistics Service (NASS) Census of Agriculture (Fig. 1c). While this census ignores small farm operations by only tracking farms that sell more than US$1,000 per year, it includes most large honeybee operations. Finally, we obtained agricultural distribution data from the Crop Data Layer33 (Fig. 1b) and climatological data from CHELSA34. Because we modelled occupancy across space and time, estimated effects can be driven by changes in predictors across both space and time.
To select predictors for the occupancy models, we relied on structural causal model analysis, which uses directed acyclic graphs (DAGs). DAGs are a visual representation of the presumed relationships between predictor variables and can help identify potential controlling variables in the context of multiple regression35. In a DAG analysis, we first construct a diagram that includes all potential relationships between all potential predictor variables. This is done using previous knowledge about the system. For example, the amount of pesticide applied in a county probably depends on the amount of agriculture in that county. Next, we compared candidate DAGs using methods that leverage the statistical correlations among our predictor variables to arrive at a best DAG (Extended Data Fig. 1). Once we settle on a DAG that both represents potential relationships between variables and is consistent with the data, we identify the minimal set of variables needed to estimate the effect of our predictor(s) of interest. This analysis allows us to block confounding paths using the ‘backdoor criterion’. Namely, we identify which variables can confound the effect of the predictor(s) of interest. The main result is to avoid overcontrolling by including mediator or collider variables. While including many variables in an analysis can increase the predictive ability of a model, it may not allow for inference on effect sizes of the predictor of interest. Instead, by carefully considering potential confounders, colliders and mediators, we determine which minimal set of variables is needed to correctly estimate effect size(s) of the predictor(s) of interest. These steps are conducted before a regression analysis. Once a predictor set is chosen, we run the multispecies occupancy models. While a full overview of DAG analysis is beyond the scope of this paper, these steps have been summarized for ecological approaches in ref. 36, have been identified as crucial for robust inferences in occupancy models in ref. 37 and are explained in ref. 35.
Results
We found that the mean effect of pesticide on species occupancy across all families was negative (Fig. 2a). This effect was strongest (95% Bayesian credible intervals do not overlap zero) for Andrenidae and Apidae, and Colletidae/Melittidae, and negative (but 95% Bayesian credible intervals overlap zero) for Halictidae and Megachilidae. For the different families, this translates into the following declines in mean occupancy probability (for a corresponding increase in pesticide use from zero to the maximum observed value in our dataset): 43.3% decline in Apidae, 28.9% in Andrenidae, 23% in Colletidae and Melittidae, 19% in Halictidae and 0.4% in Megachilidae (Fig. 3). These findings were qualitatively unchanged under multiple possible classifications of animal-pollinated agriculture. Namely, it did not matter whether we considered animal-pollinated agriculture those crops that (1) need pollination, (2) attract pollinators or (3) use managed pollinators (Extended Data Fig. 3a,d). Similarly, our findings were robust to our chosen duration of the occupancy interval (Supplementary Fig. 5) and whether we modelled the neonicotinoids or pyrethroids together or separately (Extended Data Fig. 4). When we aggregated these species-level effects within each genus, we found that effects varied by genus (Fig. 4a, and Supplementary Figs. 6a and 7a), with estimated effects of pesticide ranging from a 54% decline to a 62% increase (for a corresponding increase in pesticide use from zero to the maximum observed value in our dataset; Extended Data Fig. 5). We found that the mean effect of animal-pollinated agriculture was positive after controlling for climate (via temperature and precipitation) for Andrenidae, Colletidae and Melittidae, and Megachilidae (Fig. 2b), and had no effect for other groups. This effect was only consistent for Andrenidae; when we used a broader definition of animal-pollinated agriculture, credible intervals overlapped with zero for all other families (Extended Data Fig. 3b,e). This effect also varied by genus (Fig. 4b, and Supplementary Figs. 6b and 7b), with the estimated effect of animal-pollinated agriculture ranging from a 23.5% decline to a 401% increase for a corresponding increase in the percent animal-pollinated agriculture from zero to the maximum observed value in our dataset (Extended Data Fig. 6). Finally, to quantify potential effects of honey bees (Fig. 2c, Model 3), we controlled for the distribution of animal-pollinated agriculture. The mean effect of honeybee colonies on wild bee occupancy was not distinguishable from zero for all groups (Fig. 2c).

a, Model 1. The mean effect size for pesticide use is strongly negative across five families. b, Model 2. The mean effect size of animal-pollinated agriculture is largely positive. c, Model 3. The mean effect size of honey bees is mixed across families. Asterisks mean that the 95% credible interval does not overlap with zero and error bars represent 95% Bayesian credible intervals. Sample sizes vary for each family but are the same for each model (Extended Data Table 1). Photos obtained from iNaturalist taken by Sam Droege under a CC-0 license. In order: Megachile fortis, Agapostemon angelicus, Colletes willistoni, Bombus griseocollis, Andrena polemonii. The family Apidae excludes Apis mellifera.
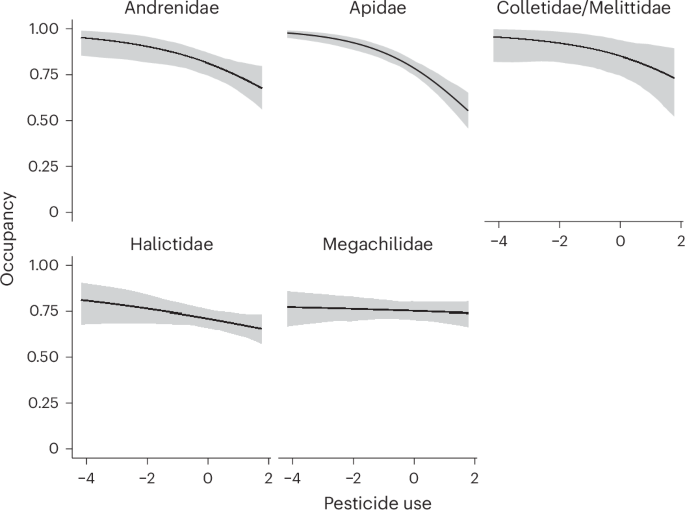
The black lines represent the mean occupancy, the shaded grey lines are the 95% credible intervals. Occupancy probability was estimated using the posterior distribution of the mean intercept and mean slope effect estimated for pesticide use while keeping all other predictors at the mean value. Pesticide use was varied from the minimum to the maximum ever observed. Pesticide use is the combined sum of kg weighted by LD50 and area, log transformed and scaled. Sample sizes vary for each family (Extended Data Table 1).

a, Model 1. The mean effect of pesticide use is strongly negative across most genera. b, Model 2. The mean effect of animal-pollinated agriculture is largely positive. c, Model 3. The mean effect of honey bees is mixed across genera. Points denote mean effects and bars 95% Bayesian credible intervals. Points and bars are coloured grey if the credible intervals overlap zero, blue if they do not overlap zero and the mean effect is positive, and orange if they do not overlap zero and the mean effect is negative. We present coefficients for all genera of bees in Supplementary Fig. 6. Sample sizes vary for each family but are the same for each model (Extended Data Table 1).
Discussion
Across the contiguous United States, we found that higher pesticide use resulted in lower occupancy of wild bees. Here, pesticides were aggregated across neonicotinoid and pyrethroid compounds, hence we interpret the pesticide use effect as a measure of pesticide intensity by county. The negative effect of pesticide use was consistent across all five families of bees and for three families, the credible intervals did not contain zero. We also found negative effects of pesticides for important crop pollinator groups. For example, we found that bumble bees (genus Bombus) are negatively affected by pesticide use. Bumble bees are important pollinators of tomatoes, eggplants, peppers and melons, among other crops38. Similarly, the genus Andrena was negatively impacted by pesticide use, and bees in this group are important pollinators of apples and a wide variety of native plants.
Laboratory and field studies have demonstrated that realistic levels of exposure to some types of pesticide have negative effects on bees. These negative effects include impairment of navigation, reduced foraging success, reduced longevity and reductions in reproductive health, among others1. Some of these studies have been conducted across multiple countries18,39 and provide a foundation for larger-scale future experiments. At country-wide scales, observational studies have demonstrated that these negative effects of pesticides do scale up to population-level trends11. Our study adds additional such evidence by documenting decreasing species occupancy across hundreds of species, a finding that is consistent with experimental studies that have evaluated landscape-level pesticide risk for bumble bees39. Further, we identify that certain groups, such as bumble bees, may be sensitive to pesticides, which could be driving stronger declines in those groups. This finding for bumble bees, in particular, is consistent with laboratory studies that have shown that they are particularly sensitive to some neonicotinoids such as acetamiprid and imidacloprid, and combinations of compounds such as clothianidin and propiconazole27,40,41.
Pesticide use had a greater impact on native bees than the presence of honeybee colonies or the type of agriculture (animal pollinated), where the effect of animal-pollinated agriculture was largely positive and the effect of honeybee colonies was indistinguishable from zero. However, we note that the honeybee data that we used in this study (the Census of Agriculture for honey-producing colonies) were coarse both spatially and temporally, and do not account for the transient nature of honeybee hives that results from their transportation around the continent during the growing season. Further, our quantification of honeybee colonies at a county level may be too coarse a spatial scale to enable detection of their full effects. The positive (but not significant) association between honey bees and some wild bees may be a consequence of beekeepers targeting areas that are also good for wild bees such as those with ample floral resources. We also note that we did not explicitly quantify the effects of habitat conversion. Land cover and pesticide intensity in our model vary across space and through time, and we do not differentiate between those types of variation, hence our estimate should not be interpreted as necessarily indicative of temporal trends only. While conversion of natural and semi-natural areas into urban or industrial areas also affects wild bees42, we found that such habitat conversion was only weakly correlated with pesticide use and the fraction of animal-pollinated agriculture. Despite the lack of data, we want to highlight that this study was only possible due to the collection, curation and release of pesticide use data by the USGS, as well as the large-scale mobilization of bee occurrence data. Extension of this approach to other parts of the world requires both spatially explicit pesticide application records, honeybee colony location data, crop usage data and new bee inventories, particularly in undersurveyed areas.
While the use of occupancy models on presence-only data is becoming more commonplace2,3,5,6,29,43,44,45, doing so requires making assumptions about how the data have been collected. In our case, we assumed that detection of some species provides information about the detection probability, and thus potential presence of other species (namely, those in the same genus). While this assumption may not always be valid (particularly when observers are only collecting a single species), recent studies have found that occupancy models are fairly robust to the inclusion of incomplete checklists46 and yield unbiased results as long as a minimum of ~50% of the collection events target multiple species30. Model caveats aside, there are no obvious mechanisms that would cause our use of presence-only data to generate statistical correlations between bee occupancy and pesticide application. Throughout the text, we have used the word ‘driver’ to link pesticides to changes in bee occupancy. We have used the strongest methods available to justify the use of such a term. However, the results of our models depend on the causal assumptions we made using the DAGs and, while our data were consistent with our DAGs, other hypotheses that include additional variables and/or links between variables might generate different outcomes.
Declining wild bee population health is troubling, particularly because wild bees are important pollinators of many crops and are essential to maintaining stability of our ecosystems in the United States. Our findings suggest that pesticide use may lower wild bee occupancy. These trends do not necessarily reflect population-level trends, particularly because changes in occupancy do not necessarily capture changes in abundance. Nevertheless, changes in occupancy only occur when a particular species either colonizes a previously vacant site or is extirpated at a site. Thus, declines in occupancy should cause concern, as the underlying patterns in abundance required to generate changes in occupancy are probably even more concerning. Analysing abundance patterns (not possible with available data) may reveal more troubling or wider-spread declines. Due to their high importance in agricultural settings and in pollinating native plants, identifying strategies that protect wild bees is necessary to ensure that these populations in the United States survive into the future. Techniques that enhance integrated pest and pollinator management (IPPM)47, which aims to co-manage both pests and pollinators, can help minimize trade-offs of pest control and pollination services. For example, increasing habitat via hedgerows has been shown to be a cost-effective method to increase pest control and pollination services48.
Methods
Bee records
We acquired North American occurrence records comprising six bee families (Andrenidae, Apidae, Colletidae, Halictidae, Megachilidae and Melittidae) from ref. 25. In ref. 25, records were downloaded from the Global Biodiversity Information Facility and Symbiota Collections of Arthropods Network, and were cleaned to ensure that (1) taxonomic names are correct and (2) erroneous records are removed. Further, ref. 25 removed records for the western honeybee (Apis mellifera) and restricted records to only those within the contiguous United States. Ref. 25 presented a total number of 1,923,814 occurrence records for 3,158 bee species from 1700 to 2021 (Supplementary Fig. 8). Of these, many are multiple observations of the same species on the same date at the same geographic location. Because the raw specimen data we used are presence-only records and because there is no measure of effort, the number of observations at a site is not a direct measure of abundance, hence treating it as such may not be appropriate. Further, because occupancy analyses use presence/absence data, rather than abundance, we reduced abundance measures to binary 0/1 (absence/presence). This resulted in a total of 634,597 unique species × date × location presence combinations (times and locations are explained below). Because our emphasis is on post-1990s pesticide application, we removed any observation from before 1994 or after 2016. Further, we removed any species that had less than 10 unique observations (unique dates and locations). We also removed species that were present in less than 3 years or 3 counties. We also removed all A. angelicus records and kept only A. texanus records because females cannot be morphologically differentiated between the two. Finally, our models only included genera for which we had data for at least three species, which resulted in a total of 1,081 bee species across the following families: Andrenidae 220 species, Apidae 284 species, Colletidae 69 species, Halictidae 221 species, Megachilidae 278 species and Melittidae 9 species.
Species ranges
For each species, we constructed plausible species ranges by identifying all counties that intersected a convex hull drawn around all observations of that species. This resulted in the plausible set of sites where that species may be found. While this may include counties where a species would probably not be found, subsetting to an approximate species range reduces the bias that might occur if one instead modelled every species at every site4,30.
Agriculture and land use change
We obtained land cover data from the National Land Cover Database (NLCD), which provides nationwide data on land cover at a 30 m2 resolution for every 2–3 years from 2001 to 2016. The NLDC provides data for 16 land use categories. Of relevance to us is the category of ‘Cultivated crops’ (hereafter agriculture), which contains areas used for the production of annual crops such as corn, soybeans and vegetables, perennial woody crops (such as orchards and vineyards), and land actively tilled49. For each county, we calculated the proportion of the county covered in agriculture. While this database does not cover every year in our study, we interpolate the data within years. This is appropriate given that the amount of agricultural cover generally did not change appreciably within counties between 1995 and 2015.
With the NLCD, we also evaluated whether the loss of natural habitat was correlated with pesticide use or animal-pollinated agriculture. We defined as ‘Natural or semi-natural area’ the following land cover categories: Deciduous forest, Evergreen forest, Mixed forest, Woody wetlands, Emergent herbaceous wetlands, Shrub/Scrub, Grassland/Herbaceous, Sedge/Herbaceous and Pasture/Hay. We tested whether changes in natural or semi-natural areas were associated with the amount of pesticide use or agricultural cover. We found low correlations between the loss of natural areas and the amount of pesticide applied (between −0.157 and −0.206). Therefore, we do not consider further the effect of land use change as it relates to the effect of pesticide use or animal-pollinated agriculture.
Type of agriculture
We obtained crop cover data from the Crop Data Layer (CDL), which provides nationwide agricultural land cover data at a 30 m2 resolution. Because the amount of agricultural cover did not change appreciably through time, we only used agricultural cover data from 2008 (the first year to cover all states) to quantify crop types for all years of the analyses. The CDL provides information on 137 types of cover33. For each crop category, we also divided crops into ‘Non-animal-pollinated agriculture (NAPA)’ and ‘Animal-pollinated agriculture (APA)’. We considered three ways to categorize animal and non-animal-pollinated agriculture. First, we divided crops depending on whether they require pollination (presented in the main text); second, we divided crops on the basis of whether they use managed pollinators; and third, we divided crops depending on whether they attract pollinators (even if they do not require pollinators). For crops that do not require pollination, we included the following crops: corn, wheat, rice, soybean, sorghum, barley and oat. All of the other types of crop were considered in the APA category. Second, we used the USDA ‘Attractiveness of Agricultural Crops to Pollinating Bees for the Collection of Nectar and/or Pollen, 2017’. Here we separated crops on the basis of whether they used managed pollinators. This is because even though a crop may require animal pollination, it may not be supplemented by managed pollinators. The crops included in the category of not using managed pollinators were: barley, dry beans, chickpeas, corn, cotton, eggplants, garlic, grapes, hops, lentils, lettuce, oats, olives, oranges, peas, pistachios, potatoes, rice, rye, sorghum, soybeans, sugarbeets, sugarcane, sweet potatoes, tobacco, triticale, vetch, walnuts, winter wheat, durum wheat, spring wheat, turnips, celery, mustard, citrus, pecans, millet and flaxseed. All other crops were considered to supplement pollination via managed pollinators (Extended Data Fig. 7c). We also selected crops that do not necessarily require pollination but may attract pollinators and, therefore, expose wild bees to pesticides. In the ‘Non-attractive to pollinators agriculture’ category we included: barley, grapes, hops, lentils, oats, onions, pistachios, rice, rye, sugarcane, triticale, walnuts, winter wheat, durum wheat, spring wheat, pecans and millet. All other crops were considered to attract pollinators (Extended Data Fig. 7d). These additional categorizations of ‘animal-pollinated agriculture’ did not result in substantially different model estimates (Extended Data Fig. 3). For each county, we calculated the proportion of the county that is APA. Proportions were scaled and log transformed to ensure normality.
Pesticide use
We obtained pesticide use data from the USGS Pesticide National Synthesis Project, which provides national data on pesticide use for each county for every year from 1992 to 2021. The pesticide use data are provided as kg of active ingredient used in each county for 448 active ingredient types31. From these active ingredients, we considered neonicotinoids and pyrethroids because (1) they are known to be highly toxic to honey bees (via LD50 measurements), (2) the usage of neonicotinoids increased during the study period, and the usage of pyrethroids remained constant, while the amount of kg used of other classes of insecticides decreased (Extended Data Fig. 2) and (3) because neonicotinoids and pyrethroids have been previously identified as problematic due to their increased toxicity when combined with fungicides1. Specifically, we included in our analyses the following neonicotinoids: acetamiprid, clothianidin, dinotefuran, imidacloprid, thiamethoxam and thiacloprid; and the following pyrethroids: cyfluthrin, cypermethrin, permethrin, tefluthrin, tralomethrin, fenvalerate, deltamethrin, cyhalothrin-gamma, resmethrin and fluvalinate-tau. Because pesticides vary by orders of magnitude in toxicity, we weight each chemical by its contact LD50, as measured on honey bees (following the procedure in ref. 50), before we sum chemicals together. While LD50 measurements collected on honey bees may differ from LD50s for wild bees, such measurements for native bees generally do not exist. Further, we expect that LD50 measured on honey bees should broadly reflect toxicity of different active ingredients for native bees. We acquired LD50 estimates from the EPA ECOTOX Database32. For all results, we standardized the mean response to be in units of ng per bee, and we removed any LD50 estimate that could not be standardized in this way. We only used LD50 from studies that estimated acute toxicity (studies whose duration was less than 4 days) because they characterized most studies. We removed any study that did not report the duration. For each compound and using only contact exposure, we calculated the mean LD50 across studies for each compound (Supplementary Table 1). We only used contact LD50 because this was the most commonly tested across compounds. We set to zero each county × year × compound combination that did not have any pesticide application data. To calculate the total pesticide use, we summed the kg of pesticides used per year per county across LD50 weighted compounds. We then divided the total amount of pesticide use by the area of the county to normalize for county size. Because we estimated occupancy at 3-year intervals (see below), we averaged 3 years of pesticide use for every county. To ensure the data were normally distributed, we log transformed the weighted sums and converted values into standard normal deviance to facilitate comparisons between different predictors. Because the application amounts of pyrethroids and neonicotinoids are highly correlated (correlation per year varies from between 0.30 when neonicotinoids were rarely applied in 1996 to 0.94 in 2008), we ran models where pesticides of both classes were combined or separated. Animal-pollinated agriculture was not highly correlated with pesticide use across all of the counties modelled (Supplementary Fig. 9)
Honeybee hives
The NASS produces surveys and reports in their Bee and Honey Program51. Since 2002, NASS has conducted the Census of Agriculture, which surveys any farm that reports revenue in excess of US$1,000. In this census, NASS collects information on the number of colonies, the number of farms, the amount of honey produced and the total sale of honey products. Thes data are available for the years 2002, 2007, 2012 and 2017. We divided the total number of colonies used by the area of the county to normalize for county size and then log transformed and scaled the data. Because these data lack seasonal information, they do not allow us to incorporate information about when the hives were actually present in farms.
Temperature and precipitation
We obtained climatic variables (both temperature and precipitation) from the CHELSA high-resolution climate data34. Through the CHELSA time series, we were able to obtain monthly precipitation and maximum temperature at 30 arc-seconds resolution (~1 km). To calculate the yearly maximum temperature for every county, we extracted the maximum temperatures for the entire year and averaged the values within each county. Of these, we selected the maximum value per year. To calculate total precipitation, we extracted the precipitation for every month of the year, and averaged it within each county and across every year. We averaged both maximum temperature and mean precipitation across the number of time visits in a time interval to ensure consistency in the sensitivity analysis. We then scaled temperature and precipitation across all counties and years.
Data processing
Because pesticide use data are reported at county level, we calculated every other environmental predictor at county level and report each county as a ‘site’. We applied occupancy-detection models to historical data using the approach of ref. 30. This approach requires specifying time intervals over which to estimate occupancy, and sub-intervals over which to estimate detection. We used 3 years as the time interval to estimate occupancy, and 1 year as the time interval to estimate detection. As a result, we did not model seasonal and within-year variation in occupancy. Recent studies have shown that trends inferred by occupancy models are robust to the choice of closure period (that is, the time period at which occupancy is estimated)45 and spatial grain5,45. We conducted a sensitivity analysis where we considered occupancy intervals from 2 to 5 years; results were qualitatively unchanged from those in the main text that use a 3-year interval (Supplementary Figs. 5, 10 and 11). We inferred that a visit to a site that might have detected a given species (for example, a potential of 0 or 1) occurred only when at least one other species in the same genus as that species was observed in the same year and county, and we only did this for sites that fall within that species’ range. Because of this, we excluded any species where there are fewer than three species in a genus. The application of occupancy models to presence-only data is a growing field2,3,5,6,29,43,44,45. These studies have successfully leveraged the assumption that the presence of another species can inform non-detections for related species. Occupancy models can be robust to the breaking of this assumption, depending on the underlying data. For example, ref. 46 showed that inferences from occupancy models are robust to the combination of complete and incomplete checklist data. Further, ref. 30 found that using occupancy models that inferred non-detections on the basis of other species’ presences performed relatively well when applied to datasets comprising as much as 50% of sampling events where a collector was only seeking a single species.
However, it remains to be shown how sensitive these methods are to the taxonomic scope over which inferences about non-detections are extrapolated. We inferred non-detections across species at the genus, subfamily or family level. When inferring non-detections at the family level, we found that genera that are harder to identify tended to show declining trends (results not shown); however, when we inferred non-detections at the genus level, trends were consistent with those reported by experts. Our approach implicitly assumes that search effort, collection, identification and digitization of a species are comparable for different species within the same genus. While this may not be the case individually across all species, our analysis does allow for some genera to be under-identified or underdigitized compared with other genera via the non-detection imputation. We modelled each bee family separately, except for Colletidae and Melittidae, which we modelled together due to their containing a lower number of species.
Because not all families were observed in every county, we only modelled county × time interval combinations that had the presence of a species from a given family. Consequently, we modelled Andrenidae in 626 counties, Apidae in 1,763 counties, Halictidae in 1,046 counties, Megachilidae in 970, and Colletidae and Melittidae in 500 counties (Extended Data Fig. 8).
We matched the temporal scale of the occurrence data and all of the predictors. For pesticide use, temperature and precipitation, this process was fairly simple because all of these datasets were reported yearly. Therefore, we averaged them over the period over which we estimated occupancy (3 years in the main results and 2–5 years in the sensitivity analysis). For the number of honeybee colonies, we had to rely on the NASS census of agriculture data which are only available for the census years 2002, 2007, 2012 and 2017. Therefore, for the other periods, we interpolated values from the census year to any previous year for a given time period. For example, using 3-year time intervals, we had seven time periods (1995–1997, 1998–2000, 2001–2003, 2004–2006, 2007–2009, 2010–2012 and 2013–2015); the first 4 time intervals would use honeybee data from 2002, while interval 5 would use those from 2007, 6 would use those from 2012, and 7 would use those from 2017. We followed a similar process for the agricultural data from NLDC which is available from 2001 to 2016 at varying time intervals. The only predictor that we did not vary over time was animal-pollinated agriculture because this relied on the Crop Data Layer that was only available from 2008 onwards. Therefore, we treated this as a time-independent variable.
Causal analysis
To infer the causal effect of pesticide use, animal-pollinated agriculture and honeybee usage, we used DAGs to find the minimal set of adjustment variables, given each exposure set. First, we generated the DAG (Extended Data Fig. 1a). We used the following logic when building the DAG: we assumed that (1) conversion to agriculture has decreased the amount of floral and nesting resources available to wild bees52, (2) the expansion of agricultural landscapes has led to an increase in insecticide use53, (3) animal-pollinated crops also require the supplementation of honey bees for pollination54, (4) the presence of honey bees can affect the amount of pesticide used because one of the mitigation strategies proposed by the EPA to reduce the risk of pesticide to honey bees is to encourage the reduction of pesticide use via Managed Pollinator Protection Plans55. Furthermore, the location of agriculture in the contiguous United States is largely informed by both climate and topographical and soil characteristics. Climate (both temperature and precipitation) also affects the availability of floral resources for bees. These relationships represent the initial DAGs we created (Supplementary Fig. 4a,b).
Methods that help build a DAG use the statistical correlations among predictors to support inclusion or exclusion of potential links between variables. For example, in our data, we observed that climate variables are correlated with honeybee colony abundance, suggesting that a link should connect these two predictors. This correlation might arise because climate variables directly impact honeybee colonies or, alternatively, it could be a consequence of a third variable that mediates this effect (for example, climate might impact the types of crop that are grown, which could subsequently impact whether or not honey bees are imported). Indeed, we found that including animal-pollinated agriculture as a mediator between climate and honeybee colony abundance is supported. Construction of our DAG proceeded by using this type of logic to determine which connections should be drawn between all of our variables (Supplementary Fig. 4). We then used our final DAG to identify the combinations of predictors needed to test our various hypotheses in our occupancy models. These models differed depending on which ‘exposure’ variable we were interested in (for example, pesticide vs animal-pollinated agriculture vs honeybee colonies). While we would ideally use DAG E in Supplementary Fig. 4, we were not able to obtain floral resource data that are independent from agriculture (for example, ref. 5 estimated floral resources on the basis of the Crop Data Layer), hence we used DAG D. Fortunately, for the exposure variables we were interested in here, the final model for each remained the same whether we used DAG C, D or E.
We used the R packages dagitty56 and ggdag57 to evaluate the minimum adjustment variables to estimate the causal effect of (1) pesticide use, (2) animal-pollinated agriculture and (3) honey bees, on wild bee occupancy (Extended Data Fig. 1). To estimate the effect of pesticide use, we included both animal-pollinated agriculture and honeybee surveys (Model 1: Extended Data Fig. 1b); for animal-pollinated agriculture, we only included climate in the model (Model 2: Extended Data Fig. 1c); and for honeybee usage, we only included animal-pollinated agriculture (Model 3: Extended Data Fig. 1d).
Occupancy models
Occupancy models aim to estimate the occupancy, denoted ψ, of a given species i on a site j in an era k by accounting for imperfect detection. They do this by incorporating multiple visits to the same sites. We developed three multispecies occupancy models for bee occurrence records in the contiguous United States that estimate the effect of pesticides, animal pollinated agriculture or honey bees on species occupancy.
For all occupancy models developed here, the probability that a species i is detected at site j in era k is drawn from a Bernoulli distribution with probability pijkzijk,
where pijk is the detection probability and zijk is the true (but unknown) occupancy state. If a site is occupied, then zijk = 1, and zijk = 0 otherwise. The true occupancy state is also drawn from a Bernoulli distribution with success probability ψijk.
Both occupancy probability, ψ, and detection probability, p, can be formulated as functions of covariates, and we did this in three different ways for ψ.
Specifically, we used the following models:
Model 1
Model 2
Model 3
where the expit function is defined as:
Here, β0 denotes mean occupancy, βspecies[i] denotes a species-specific random intercept, βarea denotes a fixed effect of area on occupancy, to account for the fact that some counties are larger than others. βapa[i], βtemp[i], βprec[i], βhoneybee[i] and βpesticide[i] denote species-specific linear effects of animal-pollinated agricultural cover (apa), temperature, precipitation, honeybee colonies, and pesticide use. βtemp2[i] denotes a species-specific quadratic effect of temperature.
We assumed that species-specific slopes and intercepts are normally distributed about some mean. Specifically,
where μβapa, μβtemp, μβtemp2, μβprec, μβhoneybee and μβpesticide denote the mean effect of each corresponding predictor across species, and σ terms denote the variances about these means.
In all of the above models, we modelled detection probability as
where α0 denotes the mean detection probability, αera denotes a slope of detection through time, αspecies denotes a species-specific random intercept of detection, and αsite,era[j, k] denotes a site-specific random effect that is era specific. This latter term allows detection to vary relatively independently across sites and between eras. Specifically, we assumed
We fitted 15 occupancy models, each of the types of model presented above (1, 2 and 3) for all five families of bees.
We ran models in JAGS58 and assessed model convergence both by visually inspecting chains and checking the Gelman–Rubin statistic (we ensured that \(\hat{R}\) was <1.1 for all parameters). We used flat, uninformative priors for all parameters and ran models for 100,000 iterations, with a burn-in of 1,000 iterations and thinning every 100 iterations across 3 chains, resulting in a total of 300 posterior samples. For all analyses, we used R (v.4.3.2)59. For spatial manipulations, we used the package sf (v.1.0-15)60; for data manipulation and visualization, we used tidyverse (v.2.0.0)61 and data.table (v.1.15.0)62; and for running models, we used runjags (v.2.2.2-4)63.
Reporting summary
Further information on research design is available in the Nature Portfolio Reporting Summary linked to this article.
Data availability
North American occurrence records were acquired from ref. 25. Land cover data were obtained from the National Land Cover Database (NLCD)49 for all years from 2001 to 2016 (https://www.mrlc.gov/data/nlcd-land-cover-conus-all-years). Crop cover data were obtained from the Crop Data Layer (CDL) for 2008 (https://www.nass.usda.gov/Research_and_Science/Cropland/Release/index.php). Attractiveness of agricultural crops was obtained from the USDA ‘Attractiveness of Agricultural Crops to Pollinating Bees for the Collection of Nectar and/or Pollen, 2017’ report (https://www.usda.gov/sites/default/files/documents/Attractiveness-of-Agriculture-Crops-to-Pollinating-Bees-Report-FINAL-Web-Version-Jan-3-2018.pdf). Pesticide use data were obtained from USGS Pesticide National Synthesis Project (https://water.usgs.gov/nawqa/pnsp/usage/maps/county-level/) for all years from 1995 to 2015. LD50 estimates were acquired from the EPA ECOTOX Database32 (https://cfpub.epa.gov/ecotox/search.cfm). Honeybee colony counts were obtained from The National Agricultural Statistics Service (NASS) honey colony census51 for years 2002 to 2017 (https://quickstats.nass.usda.gov). Temperature and precipitation data were obtained from the CHELSA high-resolution climate data34 (https://chelsa-climate.org/timeseries/).
Code availability
All code needed to re-create figures and analysis can be found in GitHub at https://github.com/lmguzman/bee_occupancy.git, and is published in Zenodo at https://zenodo.org/doi/10.5281/zenodo.12668534 (ref. 64).
References
Goulson, D., Nicholls, E., Botías, C. & Rotheray, E. L. Bee declines driven by combined stress from parasites, pesticides, and lack of flowers. Science 347, 1255957 (2015).
Powney, G. D. et al. Widespread losses of pollinating insects in Britain. Nat. Commun. 10, 1018 (2019).
Graves, T. A. et al. Western bumble bee: declines in the continental United States and range-wide information gaps. Ecosphere 11, e03141 (2020).
Guzman, L. M., Johnson, S. A., Mooers, A. O. & M’Gonigle, L. K. Using historical data to estimate bumble bee occurrence: variable trends across species provide little support for community-level declines. Biol. Conserv. 257, 109141 (2021).
Jackson, H. M. et al. Climate change winners and losers among North American bumblebees. Biol. Lett. 18, 20210551 (2022).
Janousek, W. M. et al. Recent and future declines of a historically widespread pollinator linked to climate, land cover, and pesticides. Proc. Natl Acad. Sci. USA 120, e2211223120 (2023).
Burkle, L. A., Marlin, J. C. & Knight, T. M. Plant–pollinator interactions over 120 years: loss of species, co-occurrence, and function. Science 339, 1611–1615 (2013).
Garibaldi, L. A. et al. Wild pollinators enhance fruit set of crops regardless of honey bee abundance. Science 339, 1608–1611 (2013).
Winfree, R., Aguilar, R., Vázquez, D. P., LeBuhn, G. & Aizen, M. A. A meta-analysis of bees’ responses to anthropogenic disturbance. Ecology 90, 2068–2076 (2009).
Cameron, S. A. et al. Patterns of widespread decline in North American bumble bees. Proc. Natl Acad. Sci. USA 108, 662–667 (2011).
Woodcock, B. A. et al. Impacts of neonicotinoid use on long-term population changes in wild bees in England. Nat. Commun. 7, 12459 (2016).
Connelly, H., Poveda, K. & Loeb, G. Landscape simplification decreases wild bee pollination services to strawberry. Agric. Ecosyst. Environ. 211, 51–56 (2015).
Langlois, A., Jacquemart, A.-L. & Piqueray, J. Contribution of extensive farming practices to the supply of floral resources for pollinators. Insects 11, 818 (2020).
Scheper, J. et al. Environmental factors driving the effectiveness of European agri-environmental measures in mitigating pollinator loss—a meta-analysis. Ecol. Lett. 16, 912–920 (2013).
Krupke, C. H., Hunt, G. J., Eitzer, B. D., Andino, G. & Given, K. Multiple routes of pesticide exposure for honey bees living near agricultural fields. PLoS ONE 7, e29268 (2012).
DiBartolomeis, M., Kegley, S., Mineau, P., Radford, R. & Klein, K. An assessment of acute insecticide toxicity loading (AITL) of chemical pesticides used on agricultural land in the United States. PLoS ONE 14, e0220029 (2019).
Rundlöf, M. et al. Seed coating with a neonicotinoid insecticide negatively affects wild bees. Nature 521, 77–80 (2015).
Woodcock, B. A. et al. Country-specific effects of neonicotinoid pesticides on honey bees and wild bees. Science 356, 1393–1395 (2017).
Stuligross, C. & Williams, N. M. Past insecticide exposure reduces bee reproduction and population growth rate. Proc. Natl Acad. Sci. USA 118, e2109909118 (2021).
Tomizawa, M. & Casida, J. E. Neonicotinoid insecticide toxicology: mechanisms of selective action. Annu. Rev. Pharmacol. Toxicol. 45, 247–268 (2005).
Lu, C., Hung, Y.-T. & Cheng, Q. A review of sub-lethal neonicotinoid insecticides exposure and effects on pollinators. Curr. Pollut. Rep. 6, 137–151 (2020).
Bee Health: EU Takes Additional Measures on Pesticides to Better Protect Europe’s Bees (European Commission, 2013).
Soderlund, D. M. in Hayes’ Handbook of Pesticide Toxicology 1665–1686 (Elsevier, 2010).
Wojcik, V. A., Morandin, L. A., Davies Adams, L. & Rourke, K. E. Floral resource competition between honey bees and wild bees: is there clear evidence and can we guide management and conservation? Environ. Entomol. 47, 822–833 (2018).
Chesshire, P. R. et al. Completeness analysis for over 3000 United States bee species identifies persistent data gap. Ecography 2023, e06584 (2023).
Orr, M. C. et al. Global patterns and drivers of bee distribution. Curr. Biol. 31, 451–458 (2021).
Shahmohamadloo, R. S., Tissier, M. L. & Guzman, L. M. Risk assessments underestimate threat of pesticides to wild bees. Conserv. Lett. https://doi.org/10.1111/conl.13022 (2024).
Hitaj, C. et al. Sowing uncertainty: what we do and don’t know about the planting of pesticide-treated seed. BioScience 70, 390–403 (2020).
Outhwaite, C. L. et al. Annual estimates of occupancy for bryophytes, lichens and invertebrates in the UK, 1970–2015. Sci. Data 6, 259 (2019).
Shirey, V., Khelifa, R., M’Gonigle, L. K. & Guzman, L. M. Occupancy-detection models with museum specimen data: promise and pitfalls. Methods Ecol. Evol. 14, 402–414 (2023).
Baker, N. T. & Stone, W. W. Estimated Annual Agricultural Pesticide Use for Counties of the Conterminous United States, 2008–12 Technical report (US Geological Survey, 2015).
Olker, J. H. et al. The ECOTOXicology Knowledgebase: a curated database of ecologically relevant toxicity tests to support environmental research and risk assessment. Environ. Toxicol. Chem. 41, 1520–1539 (2022).
Cropland Data Layer (USDA National Agricultural Statistics Service, 2008).
Karger, D. N. et al. Climatologies at high resolution for the earth’s land surface areas. Sci. Data 4, 170122 (2017).
McElreath, R. Statistical Rethinking: A Bayesian Course with Examples in R and Stan 2nd edn (Chapman and Hall/CRC, 2018).
Arif, S. & MacNeil, M. A. Applying the structural causal model framework for observational causal inference in ecology. Ecol. Monogr. 93, e1554 (2023).
Stewart, P. S., Stephens, P. A., Hill, R. A., Whittingham, M. J. & Dawson, W. Model selection in occupancy models: inference versus prediction. Ecology 104, e3942 (2023).
Mader, E. et al. Managing Alternative Pollinators: A Handbook for Beekeepers, Growers, and Conservationist SARE Handbook 11, NRAES-186 (SARE, 2010).
Nicholson, C. C. et al. Pesticide use negatively affects bumble bees across European landscapes. Nature 628, 355–358 (2024).
Cresswell, J. E. et al. Differential sensitivity of honey bees and bumble bees to a dietary insecticide (imidacloprid). Zoology 115, 365–371 (2012).
Robinson, A. et al. Comparing bee species responses to chemical mixtures: common response patterns? PLoS ONE 12, e0176289 (2017).
Prendergast, K. S., Dixon, K. W. & Bateman, P. W. A global review of determinants of native bee assemblages in urbanised landscapes. Insect Conserv. Divers. 15, 385–405 (2022).
Kamp, J., Oppel, S., Heldbjerg, H., Nyegaard, T. & Donald, P. F. Unstructured citizen science data fail to detect long-term population declines of common birds in Denmark. Divers. Distrib. 22, 1024–1035 (2016).
van Strien, A. J., van Swaay, C. A., van Strien-van Liempt, W. T., Poot, M. J. & WallisDeVries, M. F. Over a century of data reveal more than 80% decline in butterflies in the Netherlands. Biol. Conserv. 234, 116–122 (2019).
Jönsson, G. M., Broad, G. R., Sumner, S. & Isaac, N. J. A century of social wasp occupancy trends from natural history collections: spatiotemporal resolutions have little effect on model performance. Insect Conserv. Divers. 14, 543–555 (2021).
Johnston, A. et al. Analytical guidelines to increase the value of community science data: an example using eBird data to estimate species distributions. Divers. Distrib. 27, 1265–1277 (2021).
Lundin, O., Rundlöf, M., Jonsson, M., Bommarco, R. & Williams, N. M. Integrated pest and pollinator management—expanding the concept. Front. Ecol. Environ. 19, 283–291 (2021).
Morandin, L., Long, R. & Kremen, C. Pest control and pollination cost–benefit analysis of hedgerow restoration in a simplified agricultural landscape. J. Econ. Entomol. 109, 1020–1027 (2016).
Homer, C. et al. Conterminous United States land cover change patterns 2001–2016 from the 2016 national land cover database. ISPRS J. Photogramm. Remote Sens. 162, 184–199 (2020).
Li, Y., Miao, R. & Khanna, M. Neonicotinoids and decline in bird biodiversity in the United States. Nat. Sustain. 3, 1027–1035 (2020).
Census of Agriculture (USDA National Agricultural Statistics Service, 2017).
Kline, O. & Joshi, N. K. Mitigating the effects of habitat loss on solitary bees in agricultural ecosystems. Agriculture 10, 115 (2020).
Meehan, T. D., Werling, B. P., Landis, D. A. & Gratton, C. Agricultural landscape simplification and insecticide use in the Midwestern United States. Proc. Natl Acad. Sci. USA 108, 11500–11505 (2011).
Reilly, J. et al. Crop production in the USA is frequently limited by a lack of pollinators. Proc. R. Soc. B 287, 20200922 (2020).
Environmental Protection Agency’s Policy to Mitigate the Acute Risk to Bees from Pesticide Products (US Environmental Protection Agency Office of Pesticide Programs, 2017).
Textor, J., van der Zander, B., Gilthorpe, M. S., Liśkiewicz, M. & Ellison, G. T. Robust causal inference using directed acyclic graphs: the R package ’dagitty’. Int. J. Epidemiol. 45, 1887–1894 (2016).
Barrett, M. ggdag: Analyze and Create Elegant Directed Acyclic Graphs. R package version 0.2.8 https://CRAN.R-project.org/package=ggdag (2023).
Plummer, M. JAGS: A program for analysis of Bayesian graphical models using Gibbs sampling. In Proc. 3rd International Workshop on Distributed Statistical Computing 1–10 (DSC, 2003).
R Core Team. R: A Language and Environment for Statistical Computing. https://www.R-project.org/ (R Foundation for Statistical Computing, 2021).
Bivand, R. S., Pebesma, E. & Gomez-Rubio, V. Applied Spatial Data Analysis with R 2nd edn (Springer, 2013).
Wickham, H. et al. Welcome to the tidyverse. J. Open Source Softw. 4, 1686 (2019).
Dowle, M. & Srinivasan, A. data.table: Extension of ’data.frame’. R package version 1.14.0 https://CRAN.R-project.org/package=data.table (2021).
Denwood, M. J. runjags: an R package providing interface utilities, model templates, parallel computing methods and additional distributions for MCMC models in JAGS. J. Stat. Softw 71, 1–25 (2016).
Guzman, L. M. Code for Guzman et al. 2024 Impact of pesticide use on wild bee distributions across the United States. Zenodo https://doi.org/10.5281/zenodo.12668534 (2024).
Wieben, C. M. Estimated Annual Agricultural Pesticide Use for Counties of the Conterminous United States, 2013–17 (ver. 2.0, May 2020) (US Geological Survey, 2020).
Acknowledgements
We thank M. Pennell for all the useful discussions throughout the development of this work; T. Griswold and K.-L. J. Hung for advice on the current trends of native bees, and L. Richardson for feedback on the pesticide use data; K. Parys and N. Steinhauer for information about honeybee data; all the data collectors, taxonomists and other contributors that made this study possible. This study required an enormous amount of data. We also thank the USGS Pesticide Use project, the NASS Agricultural Census project, and the USDA Crop Data Layer project, without whom we could not have had sufficient data on predictor variables. We acknowledge funding from Simon Fraser University and the Natural Sciences and Engineering Research Council of Canada (NSERC) (Discovery Grants to L.K.M. and E.E.), the Liber Ero Fellowship Program and the University of Southern California (L.M.G.), and the National Science Foundation DBI-2216927 (iDigBees).
Author information
Authors and Affiliations
Contributions
L.M.G., L.K.M., E.E. and L.A.M. designed the study. N.S.C., P.R.C., L.M.M., A.H. and M.O. provided the cleaned bee occurrence data. L.M.G. completed all of the analyses with support from L.K.M. and feedback from all authors. L.M.G. wrote the initial draft of the paper and all others edited and provided feedback.
Corresponding author
Ethics declarations
Competing interests
The authors declare no competing interests.
Peer review
Peer review information
Nature Sustainability thanks Ben Woodcock and the other, anonymous, reviewer(s) for their contribution to the peer review of this work.
Additional information
Publisher’s note Springer Nature remains neutral with regard to jurisdictional claims in published maps and institutional affiliations.
Extended data
Extended Data Fig. 1 Directed Acyclic Graphs.
Directed Acyclic Graphs (DAGS) allow us to determine the minimal set of covariates in order to estimate the effect of a given variable. DAGS provide a visual representation of cause-and-effects relationships of the processes that generate the data. Specifically, The arrows indicate causal relationships assumed to be occurring. DAGs allow us to determine which variables are needed in a model by identifying possible colliding variables (that is, those we do not want to include), and the minimal set of covariates that are needed to eliminate confounding. This allows to reduce over-controlling. First we define the DAG for all the variables of interest (A.). Then for three variables (Pesticide use, Animal pollinated agriculture, and Honey Bees), we evaluate which variables allow us to estimate each effect. To estimate the effect of Pesticide Use (B.) we need to include Animal pollinated agriculture and Honey Bees in the model. To estimate the effect of Animal Pollinated Agriculture on wild bee occupancy (C.) we need to include climate in the model. Finally, To estimate the effect of Honey Bees (D.) we need to include Animal pollinated agriculture in the model. “Including” a variable here means adding a covariate for that variable to the equation for occupancy in our statistical models.
Extended Data Fig. 2 Pesticide use from 1994 to 2015.
From 1994 to 2015 the usage of organophosphates and carbamates decreased, while the usage of neonicotinoids increased rapidly, and the usage of pyrethroids remained constant. The total kg of pesticide use was summed by year and type of insecticide, where A. shows the raw sum, while B. shows the sum log-transformed. The compounds aggregated were the following: Neonicotinoids: Acetamiprid, Clothianidin, Dinotefuran, Imidacloprid, thiametoxam, Thiacloprid; Pyrethoids: Cyfluthrin, Cyhalothrin-Gamma, Cypermethrin, Deltamethrin, Fenvalerate, Fluvalinate, Fluvalinate Tau, Permethrin, Resmethrin, Tefluthrin, Tralomethrin; Carbamates: Carbaryl, Carbofuran, Methomyl, Oxamyl, Thiodicarb; Organophosphates: Azamethiphos, Azinphos-Methyl, Chlorpyrifos, Diazinon, Dichlorvos, Fenitrothion, Malathion, Methyl Parathion, Parathion, Phosmet, Tetrachlorvinphos; Other: Abamectin, Acephate, Chlorethoxyfos, Diazinon, Dimethoate, Fipronil, Pyridaben, Sulfoxaflor. Modified from data by31,64.
Extended Data Fig. 3 Sensitivity analysis to the definition of animal pollinated agriculture.
Family-level mean effect sizes on occupancy. The mean effect size for pesticide use (A., D. Model 1) is strongly negative across all families, the mean effect size of animal pollinated agriculture (B., E., Model 2) is largely zero, and the mean effect size of honey bees (C., F., Model 3) is mixed across families. Asterisks mean that the 95% credible interval does not overlap with zero, and error bars represent 95% Bayesian credible intervals. Sample sizes vary for each family but are the same for each model (Extended Data Table 1). Panels A-C represent animal pollinated agriculture that uses managed pollinators. The crops that do not use managed pollinators are: Barley, Dry Beans, Chick Peas, Corn, Cotton, Eggplants, Garlic, Grapes, Hops, Lentils, Lettuce, Oats, Olives, Oranges, Peas, Pistachios, Potatoes, Rice, Rye, Sorghum, Soybeans, Sugarbeets, Sugarcane, Sweet Potatoes, Tobacco, Triticale, Vetch, Walnuts, Winter Wheat, Durum Wheat, Spring Wheat, Turnips, Celery, Mustard, Citrus, Pecans, Millet, Flaxseed. All other crops were considered to supplement pollination via managed pollinators. Panels D-E represent animal pollinated agriculture that is defined by crops that even though do not necessarily require pollination, they may attract pollinators and therefore expose wild bees to pesticides. In the “Non-attractive to pollinators agriculture” category we included: Barley, Grapes, Hops, Lentils, Oats, Onions, Pistachios, Rice, Rye, Sugarcane, Triticale, Walnuts, Winter Wheat, Durum Wheat, Spring Wheat, Pecans, Millet. All other crops were considered to attract pollinators.
Extended Data Fig. 4 Differential effect of neonicotinoids vs. pyrethroids on family-level mean occupancy.
Family-level mean effect sizes of neonicotinoids or pyrethroids alone on occupancy. The mean effect size for neonicotinoids is strongly negative for Andrenidae and Apidae, while the mean effect size for pyrethroids is strongly negative Apidae, ColletidaeandMelittidae, and Halictidae. Asterisks mean that the 95% credible interval does not overlap with zero, and error bars represent 95% Bayesian credible intervals. Sample sizes vary for each family but are the same for each model (Extended Data Table 1).
Extended Data Fig. 5 Effect of pesticide use on occupancy for each genera.
Mean expected county-level occupancy aggregated for every genera, decreases as neonicotinoid and pyrethroid use increases across bee families. The black line represented the mean occupancy while the shaded grey lines are the 95% credible intervals. Occupancy probability was estimated using the posterior distribution of each species intercept and each species slope effect estimated for pesticide use while keeping all other predictors at the mean value. Predicted posterior occupancy probability was then averaged across each genus. Pesticide use was varied from the minimum to the maximum ever observed. Pesticide use is the combined sum of Kg weighted by LD50 and area, log-transformed and scaled. Sample sizes vary for each family (Extended Data Table 1).
Extended Data Fig. 6 Effect of animal pollinated agriculture on occupancy for each genera.
Mean expected county-level occupancy aggregated for every genera, generally increases as the proportion of animal pollinated agriculture in a county increases. The black line represented the mean occupancy while the shaded grey lines are the 95% credible intervals. Occupancy probability was estimated using the posterior distribution of each species intercept and each species slope effect estimated for percent of animal pollinated agriculture while keeping all other predictors at the mean value. Predicted posterior occupancy probability was then averaged across each genus. The percent of agriculture that is animal pollinated in a county was log-transformed and scaled. Sample sizes vary for each family (Extended Data Table 1).
Extended Data Fig. 7 Animal pollinated agriculture by definition.
While the percent of the county that is agriculture is highly concentrated in the Midwest (2007) (A.), Animal pollinated agriculture is more evenly distributed across the country (2008) (B. - D.). B. The percent of the county that is animal pollinated excludes the following crops: corn, wheat, rice, soybean, sorghum, barley, and oat. C. The percent of the county that uses managed pollinators excludes the following crops: Barley, Dry Beans, Chick Peas, Corn, Cotton, Eggplants, Garlic, Grapes, Hops, Lentils, Lettuce, Oats, Olives, Oranges, Peas, Pistachios, Potatoes, Rice, Rye, Sorghum, Soybeans, Sugarbeets, Sugarcane, Sweet Potatoes, Tobacco, Triticale, Vetch, Walnuts, Winter Wheat, Durum Wheat, Spring Wheat, Turnips, Celery, Mustard, Citrus, Pecans, Millet, Flaxseed. All other crops were considered to supplement pollination via managed pollinators. D. The percent of the county that is agriculture that attracts bumble bees and solitary bees excludes the following crops: : Barley, Grapes, Hops, Lentils, Oats, Onions, Pistachios, Rice, Rye, Sugarcane, Triticale, Walnuts, Winter Wheat, Durum Wheat, Spring Wheat, Pecans, Millet. All other crops were considered to attract pollinators. Modified from33.
Extended Data Fig. 8 Number of counties modelled for each family.
We modelled Andrenidae across 626 counties, Apidae across 1763, Halictidae across 1046, Megachilidae across 970, and Colletidae and Melittidae across 500. For each family we only included the counties where species of that family have been observed during the time period.
Supplementary information
Supplementary Information
Supplementary Figs. 1–11 and Table 1.
Rights and permissions
Open Access This article is licensed under a Creative Commons Attribution-NonCommercial-NoDerivatives 4.0 International License, which permits any non-commercial use, sharing, distribution and reproduction in any medium or format, as long as you give appropriate credit to the original author(s) and the source, provide a link to the Creative Commons licence, and indicate if you modified the licensed material. You do not have permission under this licence to share adapted material derived from this article or parts of it. The images or other third party material in this article are included in the article’s Creative Commons licence, unless indicated otherwise in a credit line to the material. If material is not included in the article’s Creative Commons licence and your intended use is not permitted by statutory regulation or exceeds the permitted use, you will need to obtain permission directly from the copyright holder. To view a copy of this licence, visit http://creativecommons.org/licenses/by-nc-nd/4.0/.
About this article

Cite this article
Guzman, L.M., Elle, E., Morandin, L.A. et al. Impact of pesticide use on wild bee distributions across the United States. Nat Sustain 7, 1324–1334 (2024). https://doi.org/10.1038/s41893-024-01413-8
Received:
Accepted:
Published:
Issue Date:
DOI: https://doi.org/10.1038/s41893-024-01413-8
