
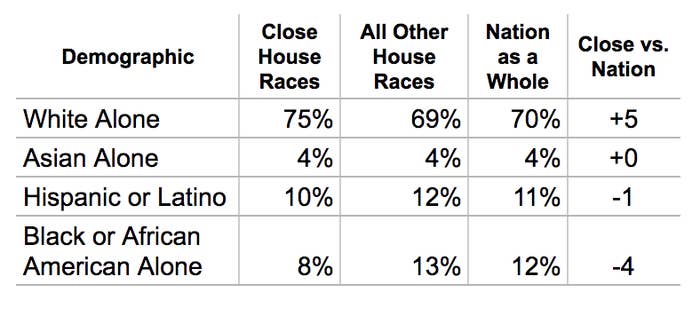
Black people are dramatically underrepresented in the key House races this year, a new analysis by BuzzFeed News has found.
Nationwide, 12% of voting-age citizens identify as black in recent census data. But in the 48 closest House races in this year’s election, only 8% do. That difference could help determine which political party controls Congress next year — a recent poll found that 82% of black voters nationally preferred a Democratic House candidate over a Republican.
It’s a phenomenon reminiscent of the sort of demographic imbalance in the 2016 Electoral College, where geography made white voters disproportionately powerful and helped give the White House to Donald Trump.
To examine this year’s electoral demographics, BuzzFeed News analyzed census data corresponding to the races where FiveThirtyEight’s 2018 House forecast gives the leading candidate less than a 3-in-4 chance of winning.
In nine of those close House races, less than 2% of voting-age citizens are black.
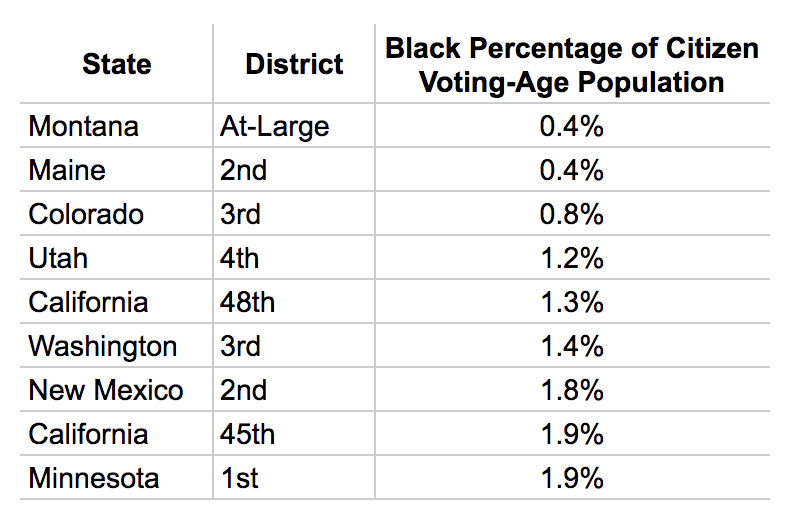
These close races also feature somewhat whiter voting-age populations than the national average. In fact, some of the closest races in the country are districts where more than 85% of voting-age citizens are white: Minnesota’s 1st District, New York’s 22nd, Michigan’s 7th, New York’s 19th, Kentucky’s 6th, Michigan’s 8th, and Kansas’s 2nd. FiveThirtyEight considers all six races to be “toss-ups” — where the publication thinks the leading candidate has less than a 60% chance of winning.
These numbers don’t necessarily represent who will vote on Nov. 6. Not all voting-age citizens are registered to vote, and even fewer actually do. But these trends show the disproportionate influence that certain demographic groups could have on the midterm elections.
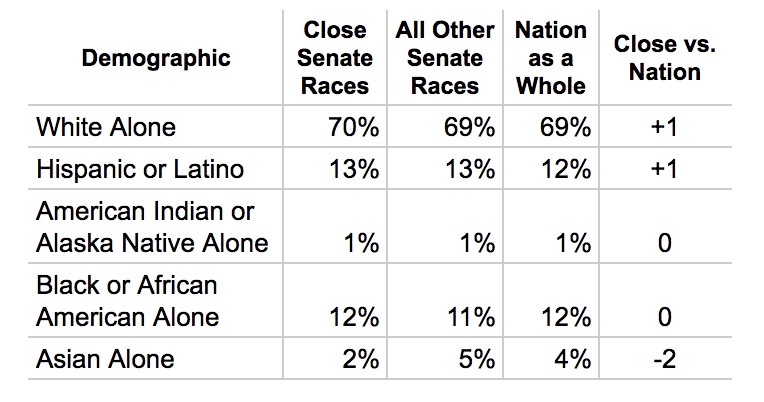
In the Senate, the closest midterm races appear to underrepresent Asian voters. Nationwide, 4% of voting-age citizens identify as Asian, compared to just 2% in the six closest Senate races. The electorate in those races is about as white as the national average (roughly 70%). But North Dakota’s close race means that Native American voters could account for a larger portion than usual — though still relatively small, at around 1%. In addition, the close races in Nevada, Florida, and Arizona mean that Hispanic voters will likely account for a slightly larger share than in other races.
But even among the close Senate races, some are a bigger deal than others. That’s because some are far more likely than others to be the “tipping point” that determines which political party controls the chamber.
FiveThirtyEight’s “Voter Power Index” — which the site provides for the Senate, but not the House — takes that factor, plus historical turnout data, into account.
North Dakota dominates the Voter Power Index. Democrat Heidi Heitkamp is running for reelection in a state that Trump won by a convincing margin in 2016. Voters there have an estimated 30 times more influence over the Senate’s majority than the average voter. The state’s voting-age citizens are also disproportionately white, giving them outsized leverage (at least numerically) in the midterms.
For example: The estimated 399,000 registered white voters in North Dakota have, in total, three and a half times the power to decide which party gains the edge in the Senate as the 639,000 black voters in Mississippi. That’s largely because although the latter state has two Senate races, both leading candidates are heavily favored to win.
Methodology
Our analyses of the House and Senate races combine FiveThirtyEight’s projections of each individual congressional race with the US census’s tabulations of citizen voting age populations in each congressional district and state.
The latest census estimates are based on the American Community Survey for 2012–2016 and are used by the government for redistricting purposes. The census tabulations cover 13 racial groups, but they are not mutually exclusive. For the calculations above, we included only the mutually exclusive demographic groups that made up at least 1% of the population in any part of the analysis.
Our analyses involving FiveThirtyEight’s Voter Power Index use the census’s count of voters registered in the 2016 election, by race. We used those demographics for the analysis because FiveThirtyEight’s Voter Power Index partially relies on estimated turnout, and registered voters are a better approximation. Even so, this analysis does not account for who actually voted or who is projected to vote, only who was registered in 2016. The demographics of each state have also likely shifted slightly in the two years since.
For additional details, see our full analysis, which also includes the computer code used to run the analyses.