The Land Sparing, Water Surface Use Efficiency, and Water Surface Transformation of Floating Photovoltaic Solar Energy Installations

 , , ,
, , ,
Abstract
:1. Introduction
2. Methods
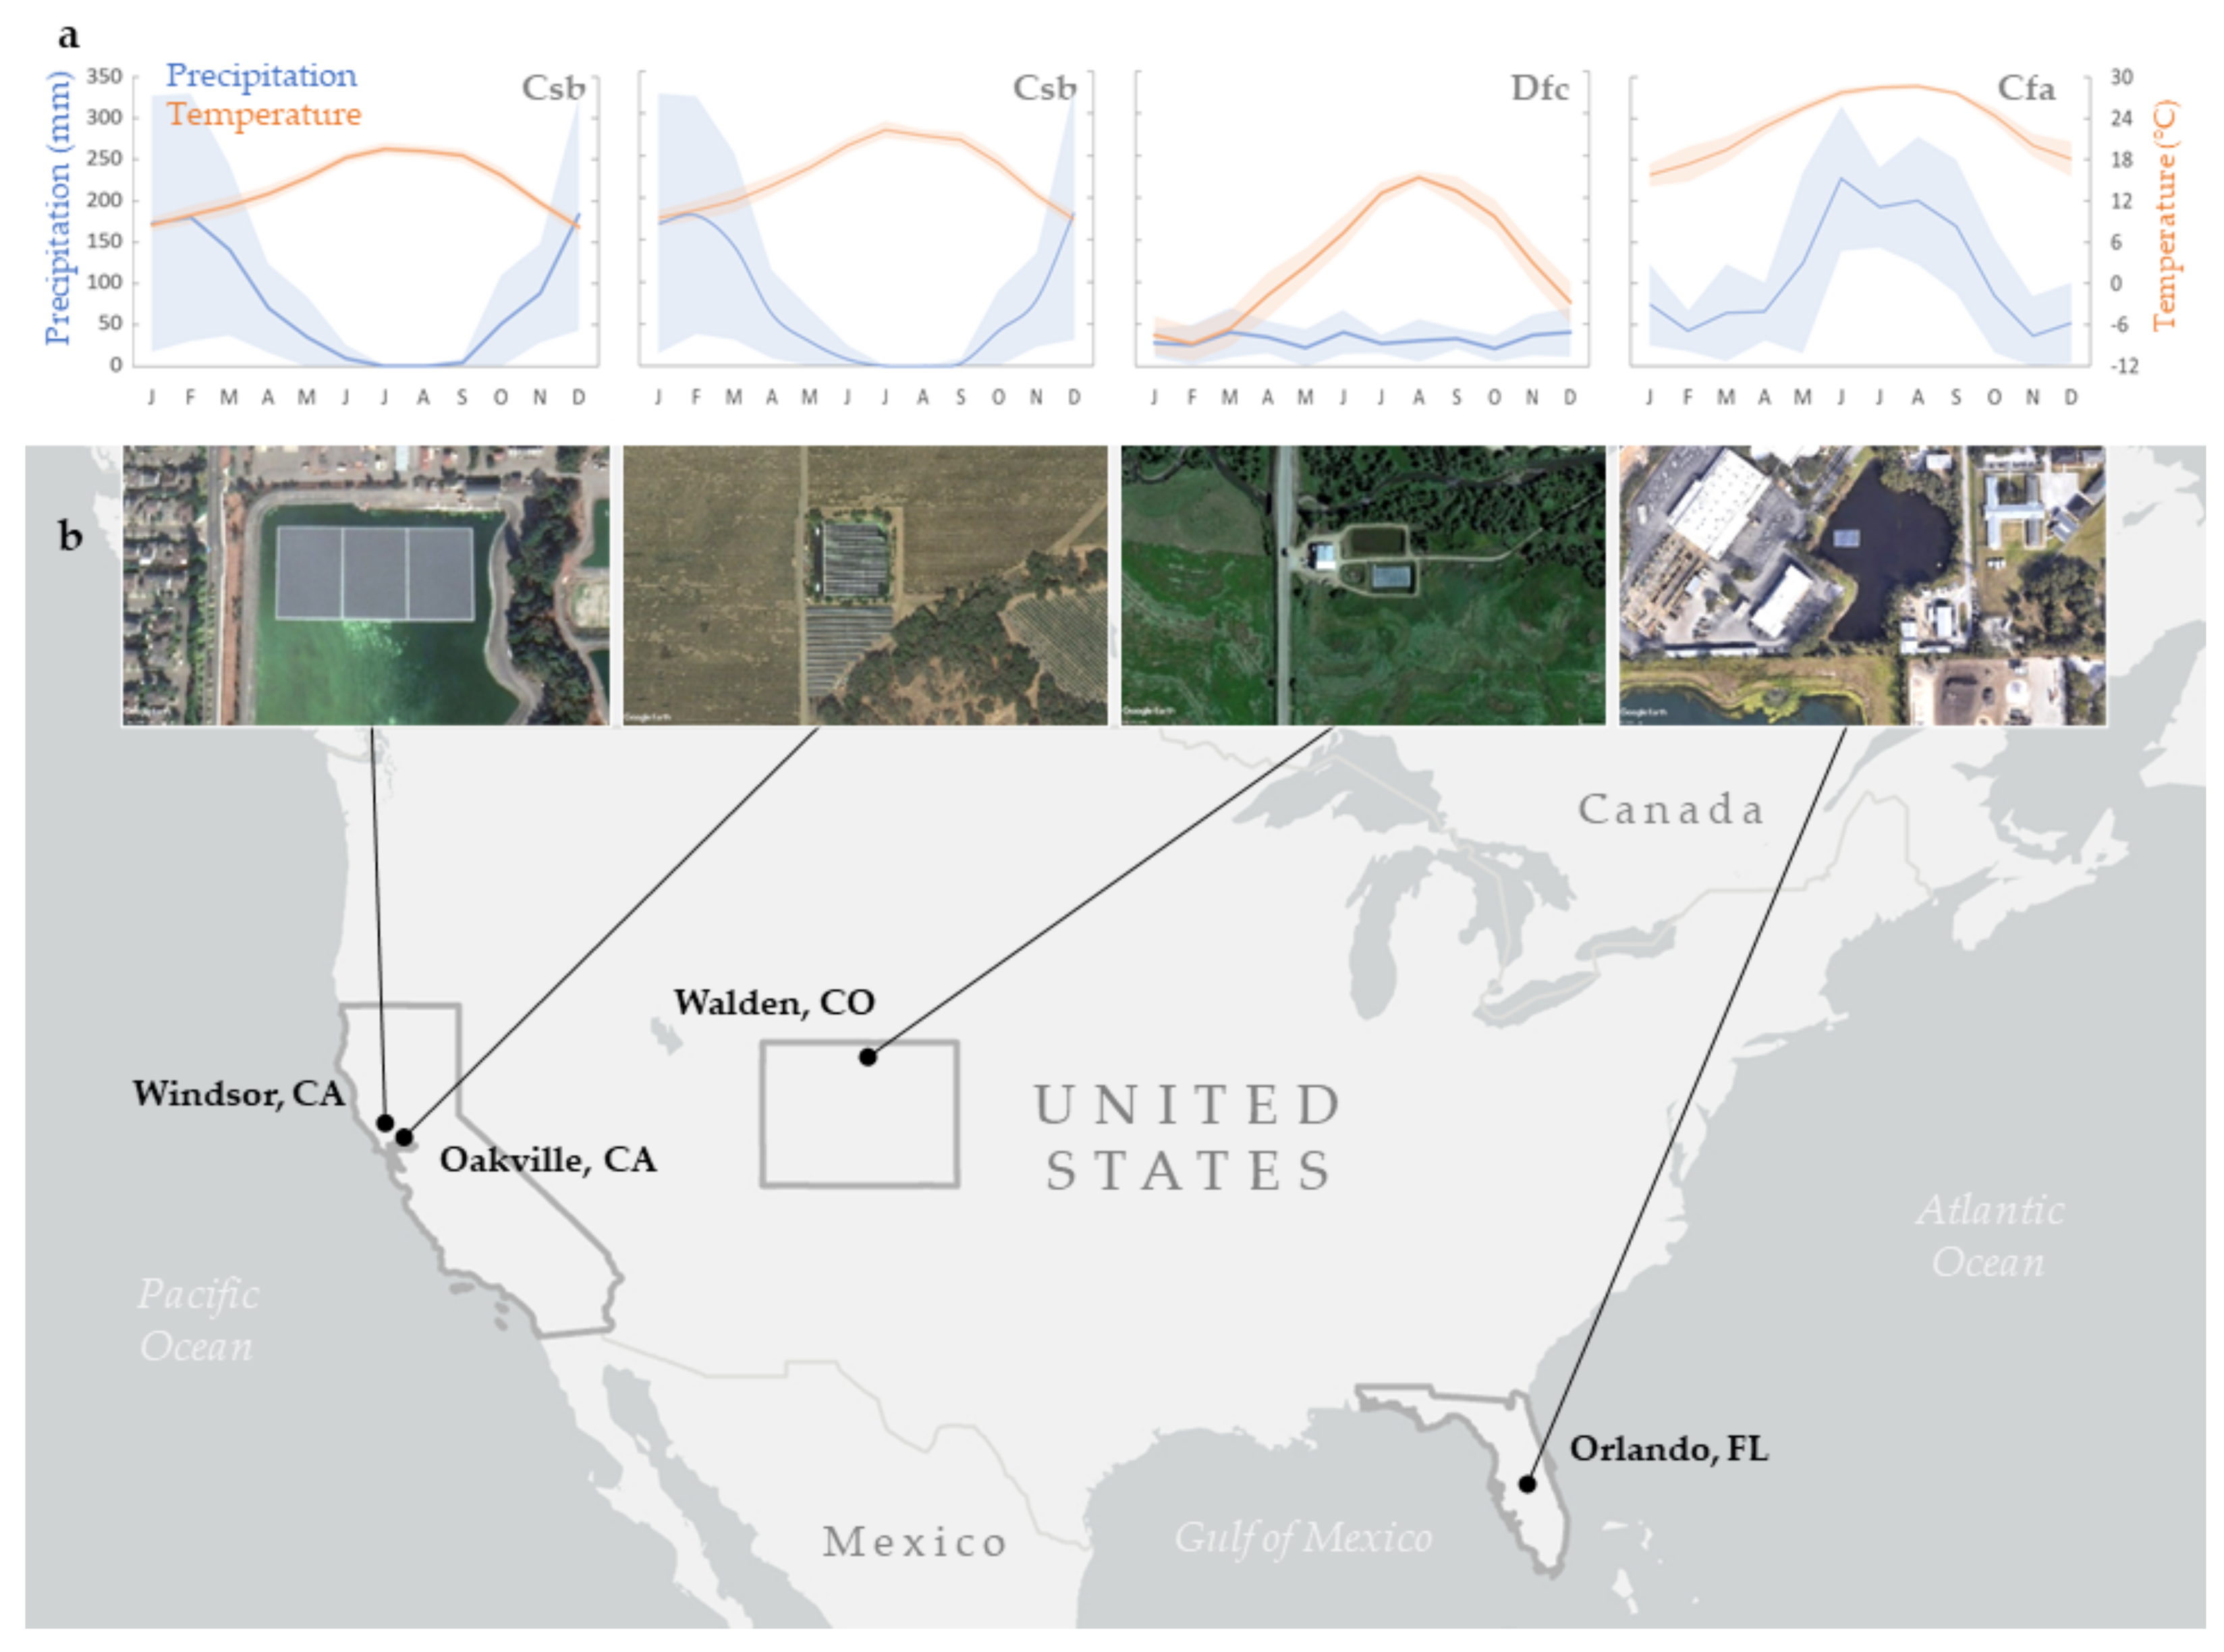
2.1. Site Selection
2.2. Collection of Climatic Attributes
2.3. Collection of Technological and Hydrological Attributes of FPVs
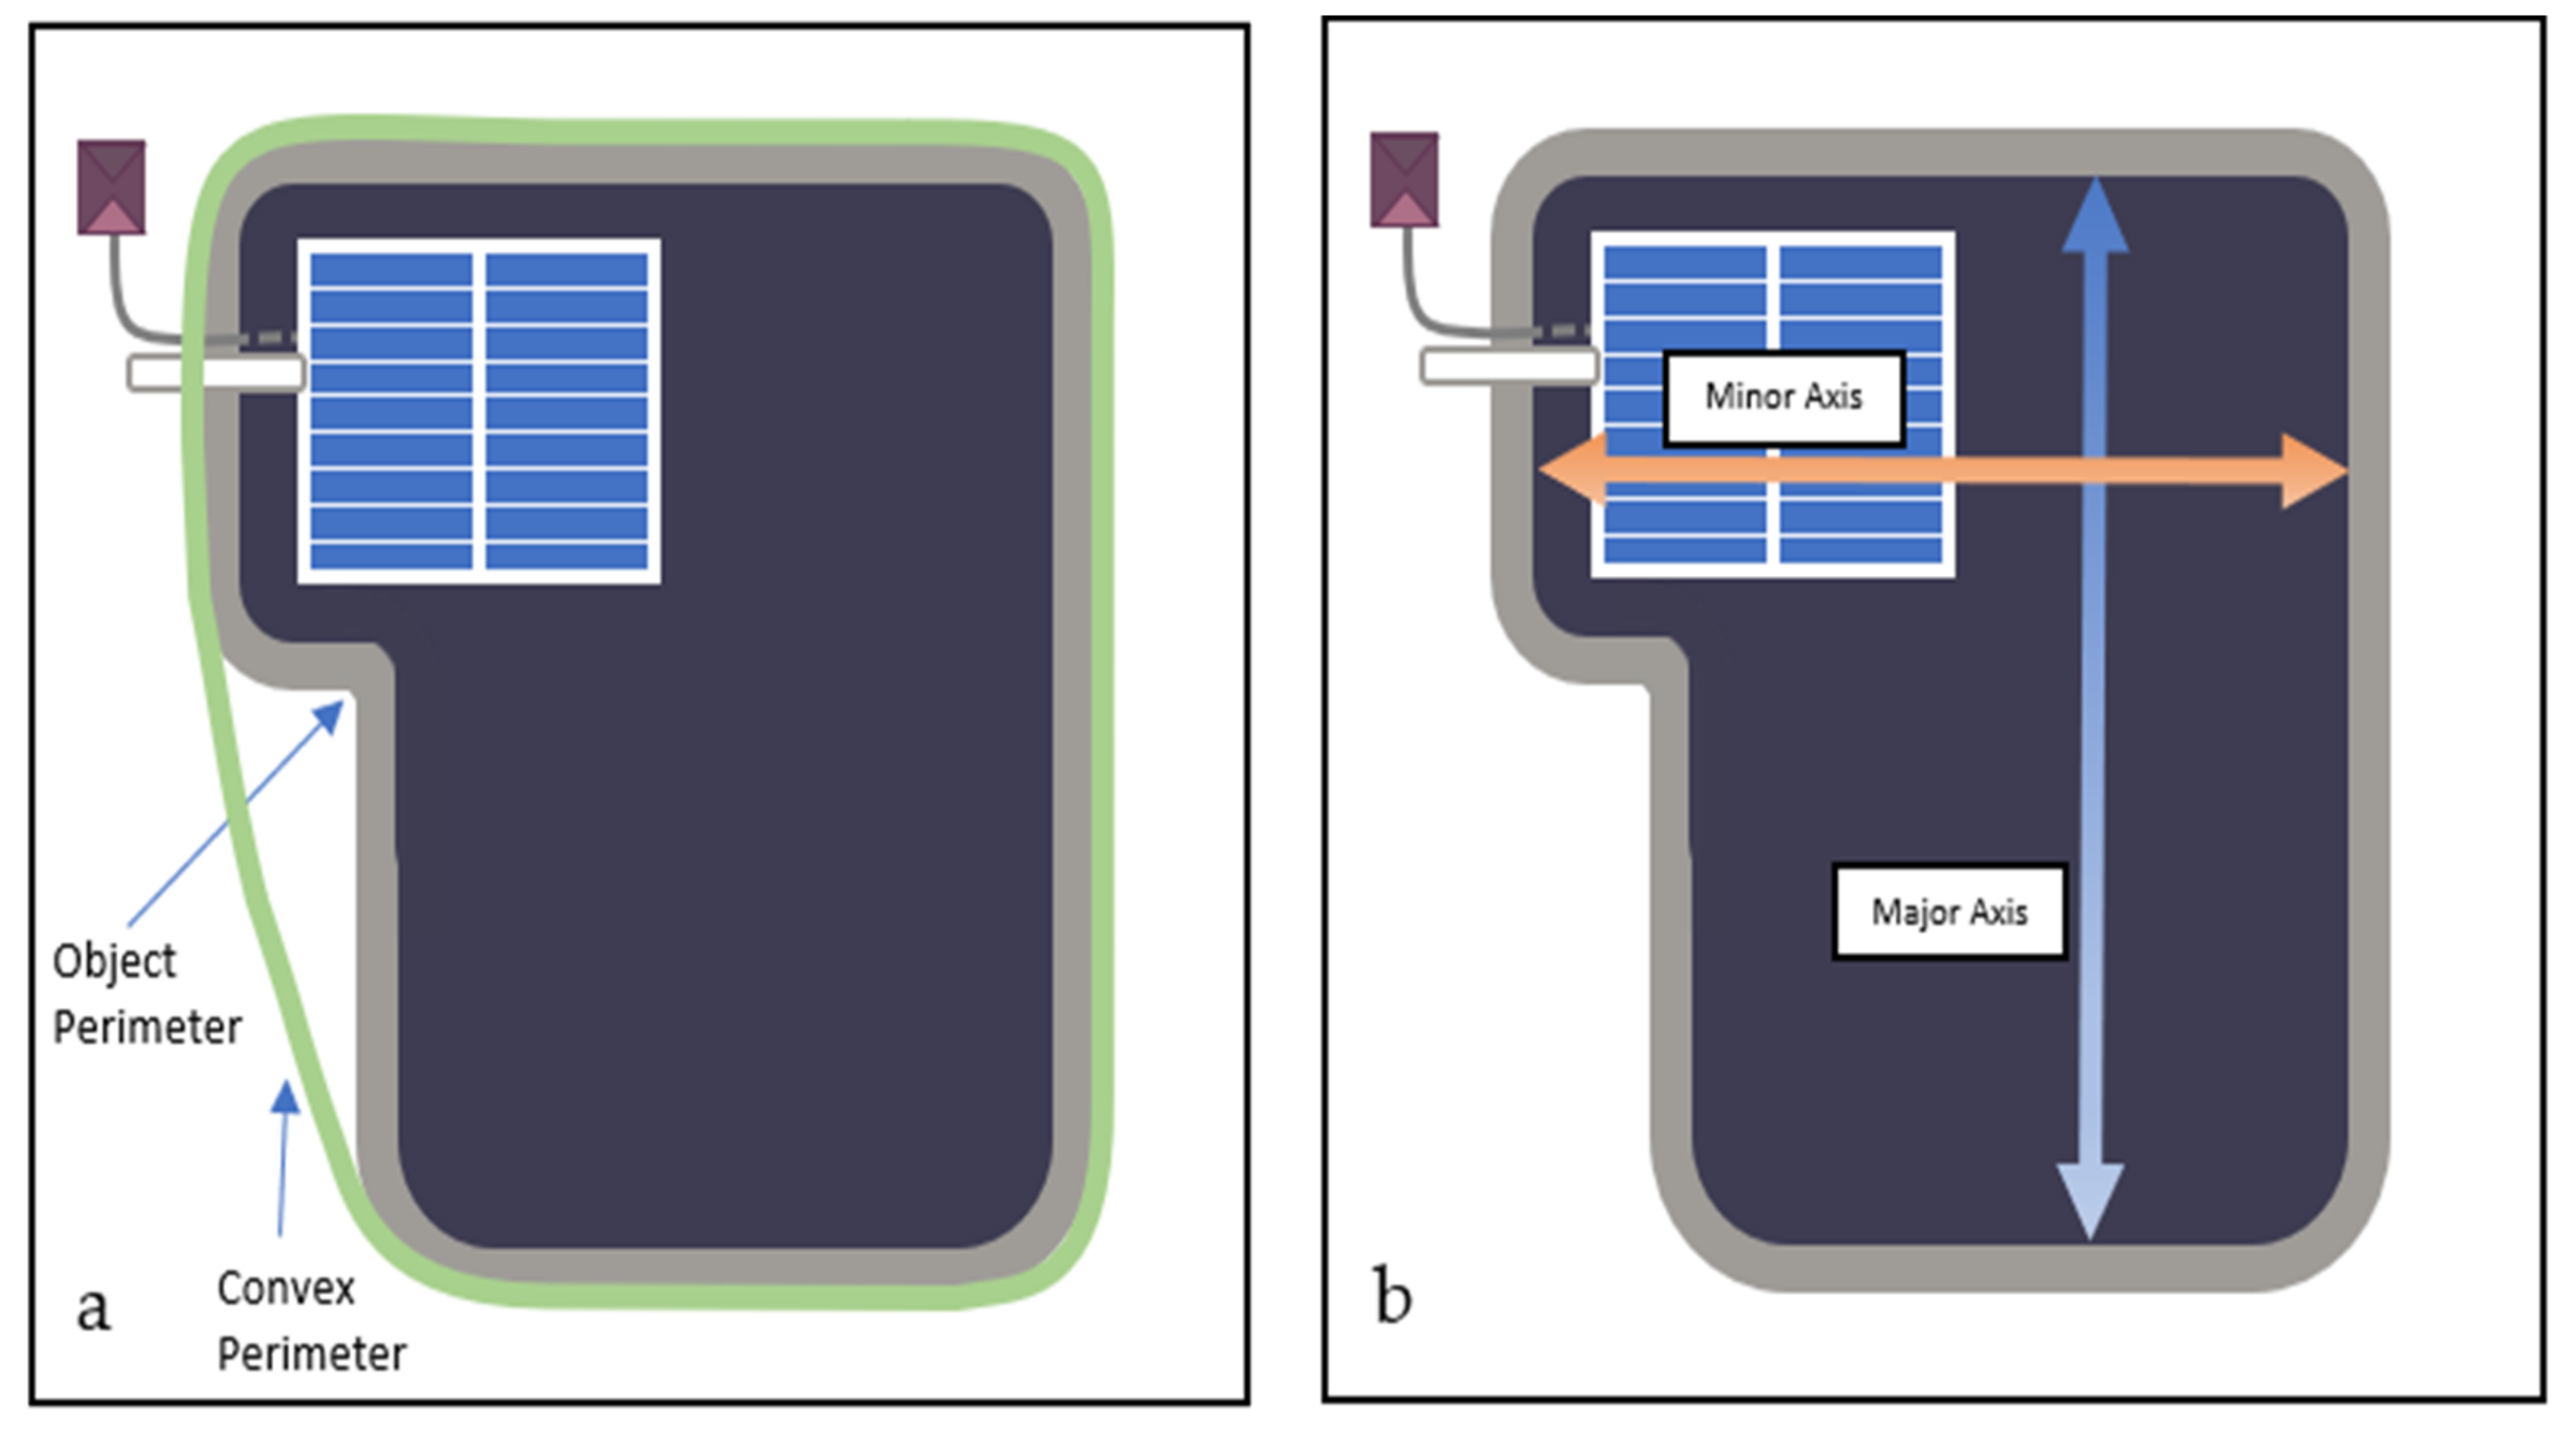
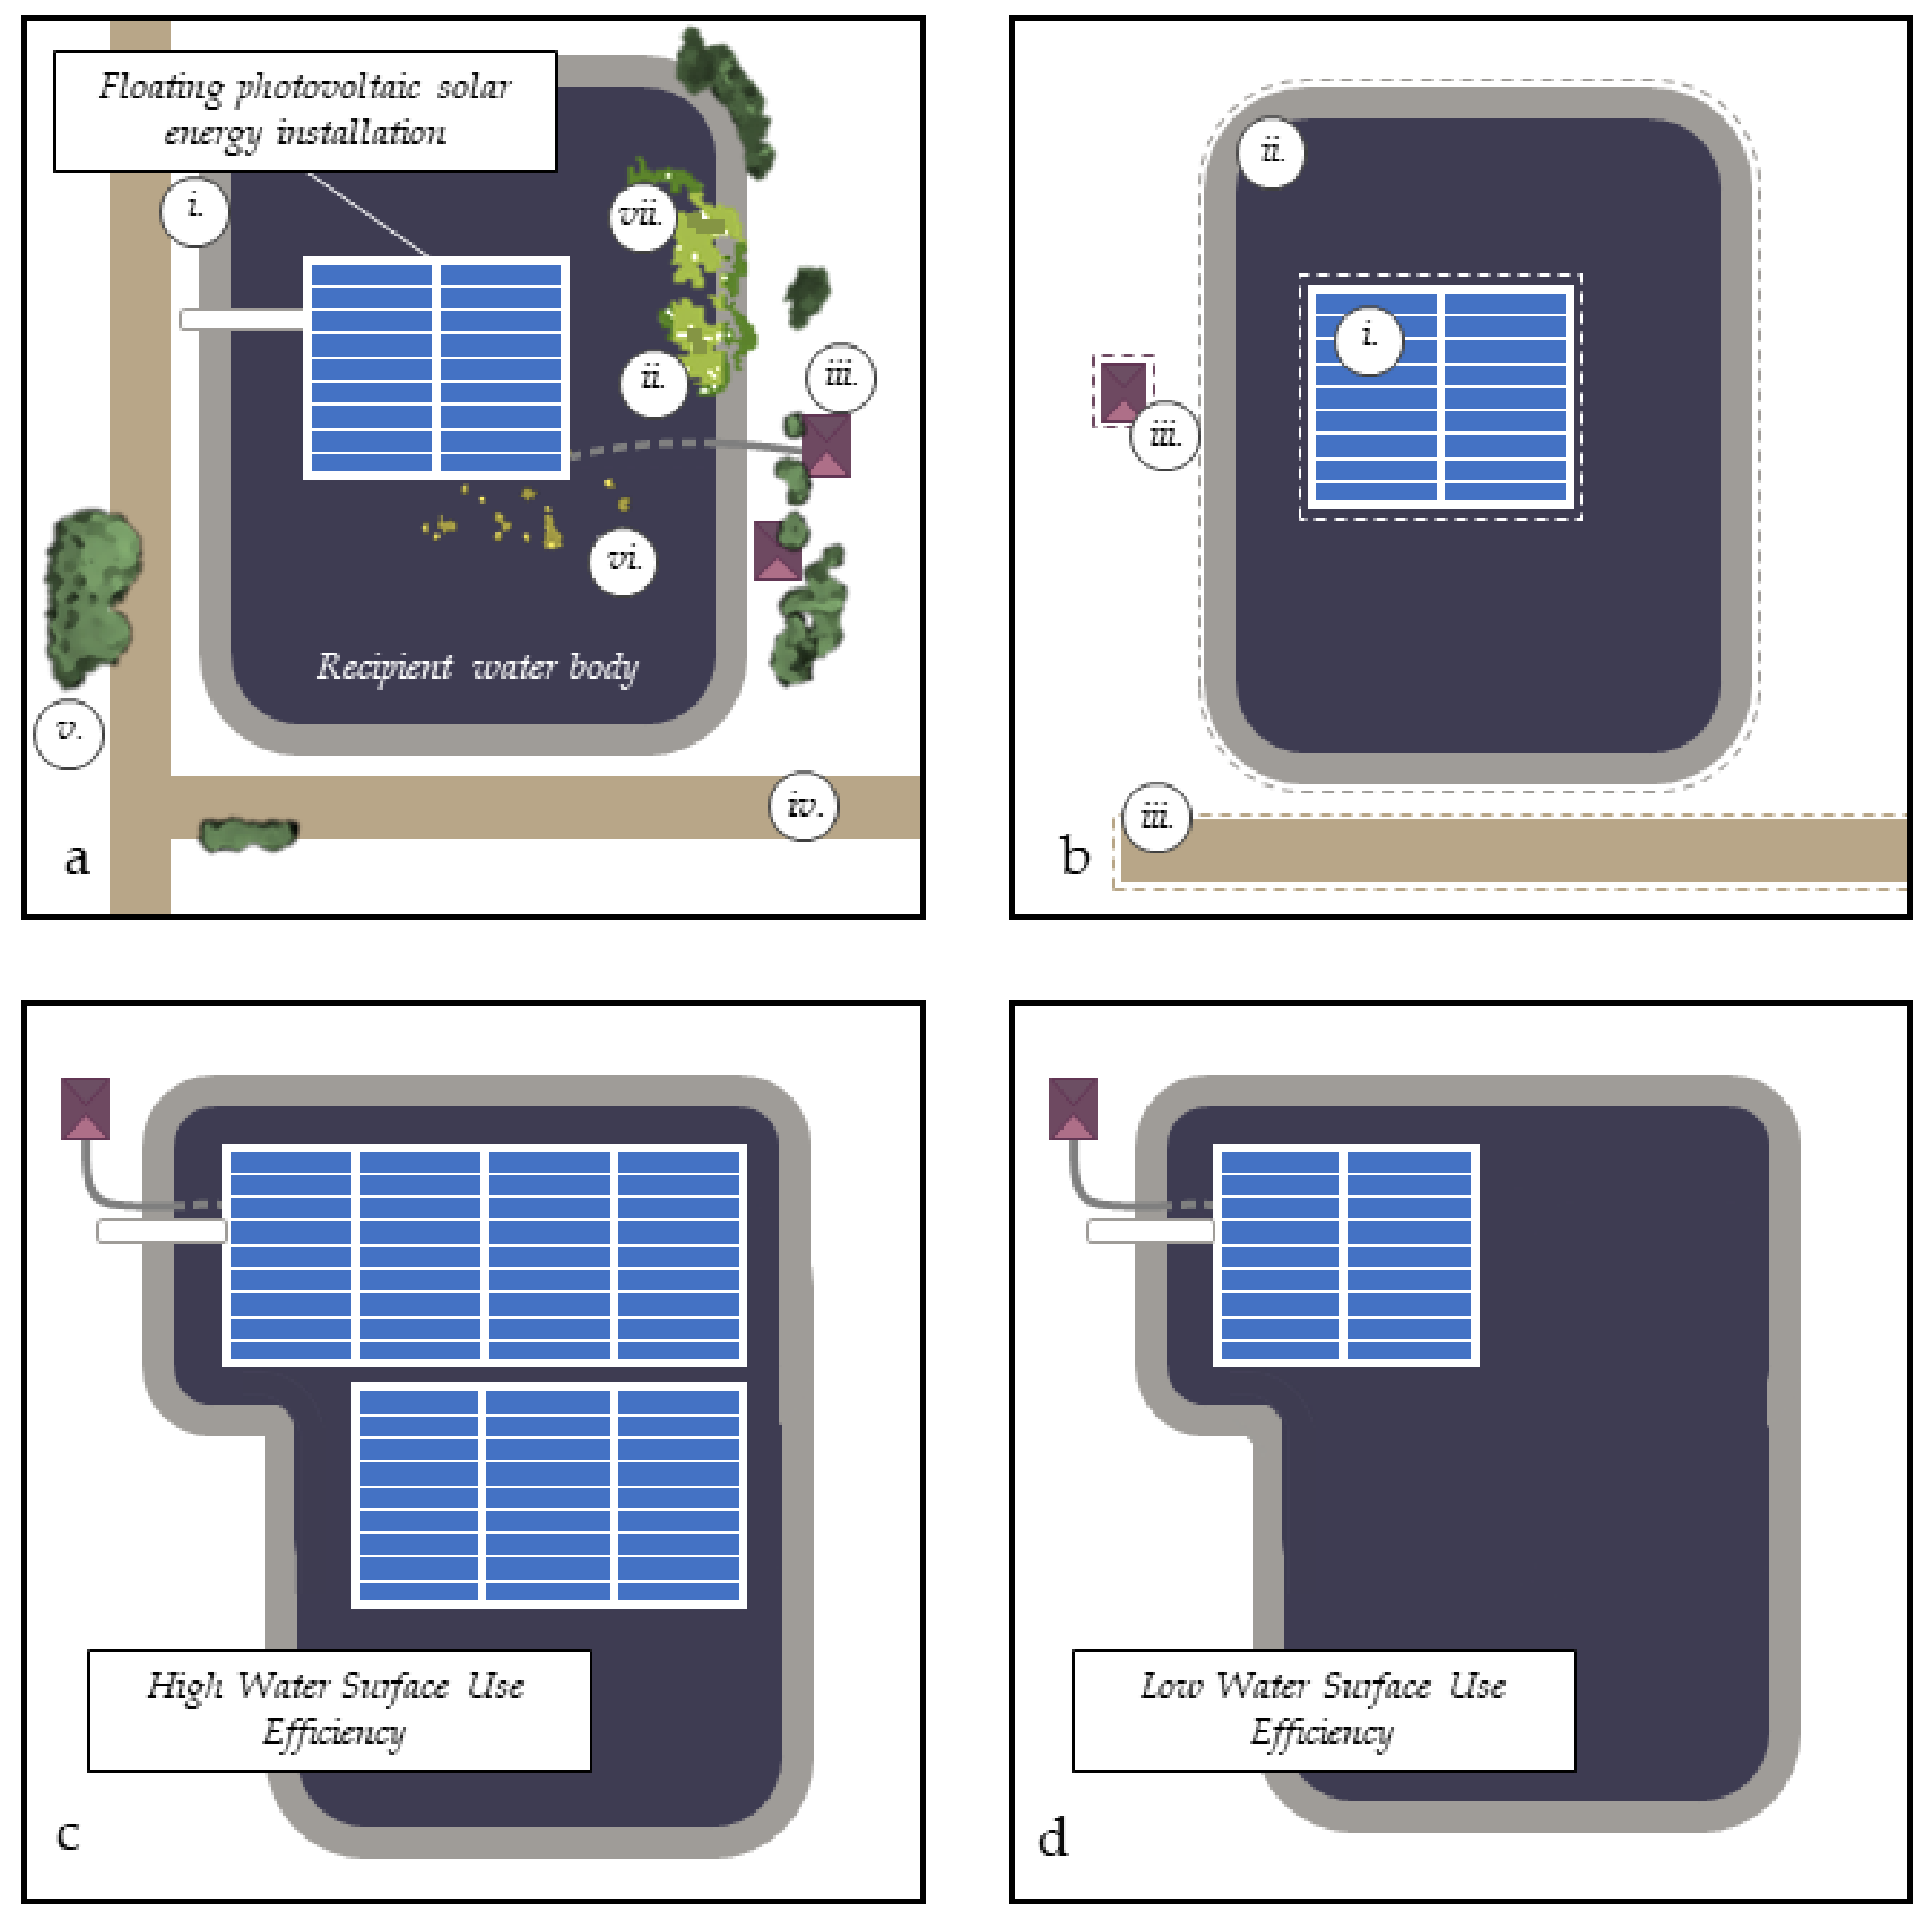
2.4. Collection of Spatial Attributes of Water Bodies
2.5. Calculation of Land Sparing
2.6. Calculation of Water Surface Use Efficiency (WSUE)
2.7. Calculating Generation-Based Direct and Total WST
3. Results
3.1. Climatic Attributes of FPVs
3.2. Technohydrological Attributes of FPVs
3.3. Spatial Attributes of FPVs and their Recipient Bodies of Water
3.4. Land Sparing, Land Sparing Ratio, and Shore-Based Land Use of FPVs
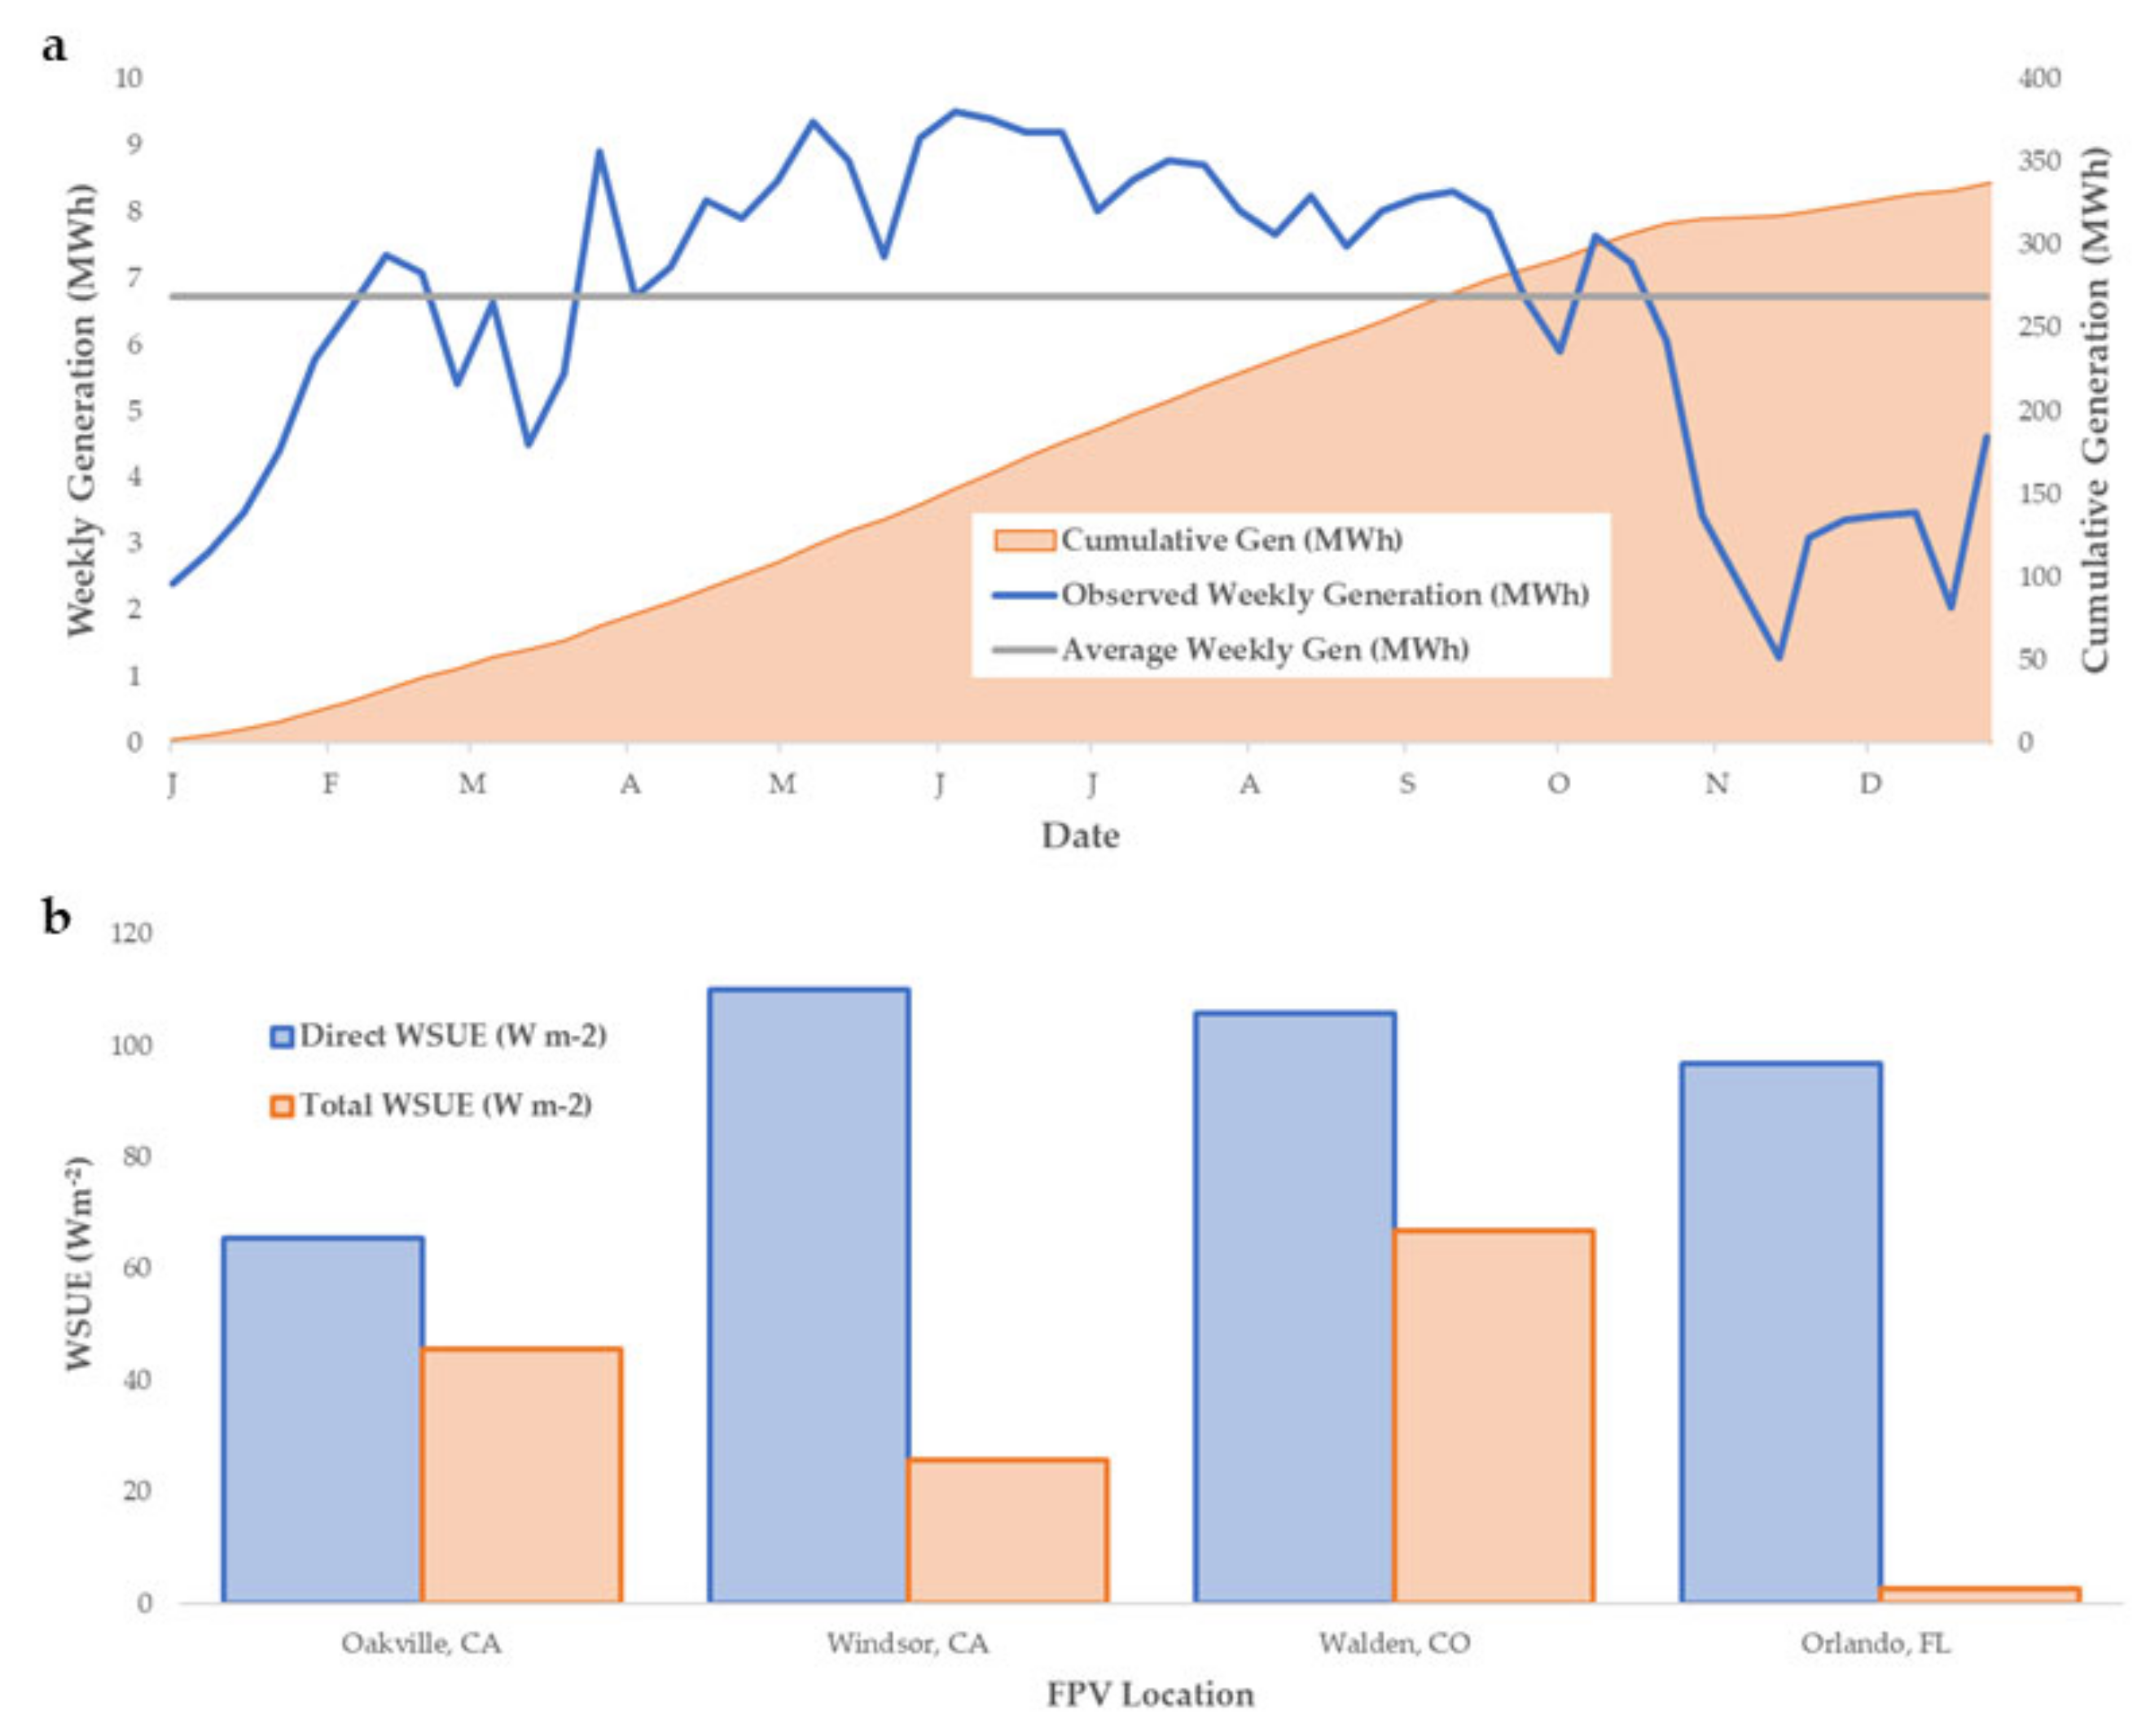
3.5. The Water Surface Use Efficiency (WSUE) of FPVs
3.6. Generation-Based Water Surface Transformation (WST)
4. Discussion
4.1. Technohydrological and Spatial Attributes of FPVs
4.2. The Land Sparing of FPVs
4.3. Water Surface Use Efficiency (WSUE) and Water Surface Transformation (WST)
5. Conclusions
Author Contributions
Funding
Acknowledgments
Conflicts of Interest
Appendix A

| Season | ||||||
|---|---|---|---|---|---|---|
| Location | Winter | Spring | Summer | Fall | Average (± 1 SD) | |
| Oakville, CA | Date | 2/5/2018 | 3/16/2016 | 5/20/2017 | 9/1/2018 | |
| FPV Present/Absent | Present | Present | Present | Present | ||
| Surface Area (m2) | 4662.0 | 4580.0 | 4655.0 | 4153.0 | 4512.5 ± 242.5 | |
| Perimeter (m) | 268.0 | 264.0 | 263.0 | 255.0 | 262.5 ± 5.4 | |
| Convex Area (m) | 4764.0 | 4681.0 | 4720.0 | 4255.0 | 4605.0 ± 235.8 | |
| Convex Perimeter (m) | 260.0 | 254.0 | 259.0 | 248.0 | 255.3 ± 5.5 | |
| Major Axis (m) | 93.4 | 88.2 | 92.6 | 88.1 | 90.6 ± 2.8 | |
| Minor Axis (m) | 84.5 | 82.3 | 84.0 | 82.5 | 83.3 ± 1.1 | |
| Windsor, CA | Date | 11/7/2019 | 3/28/2018 | 7/28/2019 | 10/23/2019 | |
| FPV Present/Absent | Present | Absent | Partial Deployment | Present | ||
| Surface Area (m2) | 67,831.0 | 71,575.0 | 70,946.0 | 67,454.0 | 69,451.5 ± 2,110.2 | |
| Perimeter (m) | 1076.0 | 1097.0 | 1093.0 | 1076.0 | 1085.5 ± 11.1 | |
| Convex Area (m) | 72,516.0 | 76,008.0 | 75,296.0 | 72,221.0 | 74,010.25 ± 1,921.7 | |
| Convex Perimeter (m) | 1048.0 | 1070.0 | 1067.0 | 1047.0 | 1058 ± 12.2 | |
| Major Axis (m) | 391.0 | 401.0 | 400.0 | 393.0 | 396.25 ± 5.0 | |
| Minor Axis (m) | 299.0 | 302.0 | 302.0 | 295.0 | 299.5 ± 3.3 | |
| Walden, CO | Date | 6/18/2014 | 9/17/2015 | 8/26/2019 | 9/7/2016 | |
| FPV Present/Absent | Absent | Absent | Present | Absent | ||
| Surface Area (m2) | 1103.0 | 1117.0 | 1068.0 | 1150.0 | 1109.5 ± 34.0 | |
| Perimeter (m) | 133.0 | 136.0 | 132.0 | 155.0 | 139.0 ± 10.8 | |
| Convex Area (m) | 1150.0 | 1172.0 | 1113.0 | 1,266.0 | 1175.3 ± 65.2 | |
| Convex Perimeter (m) | 131.0 | 132.0 | 129.0 | 139.0 | 132.8 ± 4.3 | |
| Major Axis (m) | 47.9 | 48.1 | 47.0 | 49.7 | 48.2 ± 1.1 | |
| Minor Axis (m) | 35.3 | 35.9 | 34.2 | 38.8 | 36.1 ± 2.0 | |
| Orlando, FL | Date | 1/3/2018 | 5/6/2017 | 5/8/2016 | 12/17/2018 | |
| FPV Present/Absent | Present | Present | Absent | Present | ||
| Surface Area (m2) | 1,1918.0 | 1,1127.0 | 1,1842.0 | 12,206.0 | 11,773.3 ± 458.5 | |
| Perimeter (m) | 592.0 | 533.0 | 604.0 | 628.0 | 589.3 ± 40.4 | |
| Convex Area (m) | 15,443.0 | 1,4214.0 | 1,5431.0 | 1,5891.0 | 15,244.8 ± 719.7 | |
| Convex Perimeter (m) | 473.0 | 454.0 | 473.0 | 480.0 | 470.0 ± 11.2 | |
| Major Axis (m) | 173.0 | 167.0 | 176.0 | 176.0 | 173 ± 4.2 | |
| Minor Axis (m) | 124.0 | 120.0 | 122.0 | 123.0 | 122.3 ± 1.7 |
References
- World Bank Group; ESMAP; SERIS. Where Sun Meets Water: Floating Solar Handbook for Practitioners; World Bank: Washington, DC, USA, 2019. [Google Scholar]
- Hernandez, R.; Armstrong, A.; Burney, J.A.; Ryan, G.; Moore-O’Leary, K.; Diédhiou, I.; Grodsky, S.M.; Saul-Gershenz, L.; Davis, R.; Macknick, J.; et al. Techno–ecological synergies of solar energy for global sustainability. Nat. Sustain. 2019, 2, 560–568. [Google Scholar] [CrossRef]
- Cox, M. Floating Solar Landscape. 2019. Available online: https://www.greentechmedia.com/articles/read/the-state-of-floating-solar-bigger-projects-and-climbing-capacity (accessed on 7 July 2020).
- Spencer, R.S.; Macknick, J.; Aznar, A.; Warren, A.; Reese, M.O. Floating Photovoltaic Systems: Assessing the Technical Potential of Photovoltaic Systems on Man-Made Water Bodies in the Continental United States. Environ. Sci. Technol. 2018, 53, 1680–1689. [Google Scholar] [CrossRef] [PubMed]
- Trapani, K.; Santafé, M.R. A review of floating photovoltaic installations: 2007-2013. Prog. Photovoltaics: Res. Appl. 2014, 23, 524–532. [Google Scholar] [CrossRef] [Green Version]
- Armstrong, A.; Page, T.; Thackeray, S.; Hernandez, R.R.; Jones, I.D. Integrating environmental understanding into floatovoltaic deployment using an effects hierarchy and decision trees. Environ. Res. Lett. Accepted subject to revisions.
- Hooper, T.; Armstrong, A.; Vlaswinkel, B. Environmental impacts and benefits of marine floating solar. Sol. Energy. Accepted Subject to Revisions.
- Darwish, Z.A.; Kazem, H.A.; Sopian, K.; Al-Goul, M.; Alawadhi, H. Effect of dust pollutant type on photovoltaic performance. Renew. Sustain. Energy Rev. 2015, 41, 735–744. [Google Scholar] [CrossRef]
- Hernandez, R.R.; Hoffacker, M.K.; Field, C.B. Land-Use Efficiency of Big Solar. Environ. Sci. Technol. 2014, 48, 1315–1323. [Google Scholar] [CrossRef] [PubMed]
- Armstrong, A.; Ostle, N.J.; Whitaker, J. Solar park microclimate and vegetation management effects on grassland carbon cycling. Environ. Res. Lett. 2016, 11, 074016. [Google Scholar] [CrossRef] [Green Version]
- Tanner, K.; Moore-O’Leary, K.A.; Parker, I.; Pavlik, B.M.; Hernandez, R. Simulated solar panels create altered microhabitats in desert landforms. Ecosphere 2020, 11, 03089. [Google Scholar] [CrossRef]
- Grodsky, S.M.; Hernandez, R. Reduced ecosystem services of desert plants from ground-mounted solar energy development. Nat. Sustain. 2020, 1–8. [Google Scholar] [CrossRef]
- Randle-Boggis, R.; White, P.; Cruz, J.; Parker, G.; Montag, H.; Scurlock, J.; Armstrong, A. Realising co-benefits for natural capital and ecosystem services from solar parks: A co-developed, evidence-based approach. Renew. Sustain. Energy Rev. 2020, 125, 109775. [Google Scholar] [CrossRef]
- Necefer, L.; Wong-Parodi, G.; Small, M.J.; Begay-Campbell, S. Integrating technical, economic and cultural impacts in a decision support tool for energy resource management in the Navajo Nation. Energy Strat. Rev. 2018, 22, 136–146. [Google Scholar] [CrossRef]
- Choi, C.S.; Cagle, A.E.; Macknick, J.; Bloom, D.E.; Caplan, J.S.; Ravi, S. Effects of Revegetation on Soil Physical and Chemical Properties in Solar Photovoltaic Infrastructure. Front. Environ. Sci. 2020, 8, 140. [Google Scholar] [CrossRef]
- Sahu, A.; Yadav, N.; Sudhakar, K. Floating photovoltaic power plant: A review. Renew. Sustain. Energy Rev. 2016, 66, 815–824. [Google Scholar] [CrossRef]
- Liu, H.; Krishna, V.; Leung, J.L.; Reindl, T.; Zhao, L. Field experience and performance analysis of floating PV technologies in the tropics. Prog. Photovoltaics: Res. Appl. 2018, 26, 957–967. [Google Scholar] [CrossRef]
- Waterworth, D.; Armstrong, A. Southerly winds increase the electricity generated by solar photovoltaic systems. Sol. Energy 2020, 202, 123–135. [Google Scholar] [CrossRef]
- Peters, I.M.; Liu, H.; Reindl, T.; Buonassisi, T. Global Prediction of Photovoltaic Field Performance Differences Using Open-Source Satellite Data. Joule 2018, 2, 307–322. [Google Scholar] [CrossRef] [Green Version]
- Ferrer-Gisbert, C.; Gozálvez, J.J.F.; Redón-Santafé, M.; Ferrer-Gisbert, P.S.; Sánchez-Romero, F.-J.; Torregrosa-Soler, J.B. A new photovoltaic floating cover system for water reservoirs. Renew. Energy 2013, 60, 63–70. [Google Scholar] [CrossRef] [Green Version]
- Poggi, F.; Firmino, A.; Amado, M. Planning renewable energy in rural areas: Impacts on occupation and land use. Energy 2018, 155, 630–640. [Google Scholar] [CrossRef]
- Exley, G.; Armstrong, A.; Page, T.; Jones, I.D. Floating solar panels affect temperature and stratification in lakes. status (unpublished; manuscript in preparation).
- Santafé, M.R.; Soler, J.B.T.; Sánchez-Romero, F.-J.; Ferrer-Gisbert, P.S.; Gozálvez, J.J.F.; Gisbert, C.M.F. Theoretical and experimental analysis of a floating photovoltaic cover for water irrigation reservoirs. Energy 2014, 67, 246–255. [Google Scholar] [CrossRef]
- Bailey, I.G.; Darkal, H. (Not) talking about justice: Justice self-recognition and the integration of energy and environmental-social justice into renewable energy siting. Local Environ. 2017, 23, 335–351. [Google Scholar] [CrossRef] [Green Version]
- Nerini, F.F.; Tomei, J.; To, L.S.; Bisaga, I.; Parikh, P.; Black, M.; Borrion, A.; Spataru, C.; Broto, V.C.; Anandarajah, G.; et al. Mapping synergies and trade-offs between energy and the Sustainable Development Goals. Nat. Energy 2017, 3, 10–15. [Google Scholar] [CrossRef] [Green Version]
- Trainor, A.M.; McDonald, R.I.; Fargione, J. Energy Sprawl Is the Largest Driver of Land Use Change in United States. PLoS ONE 2016, 11, e0162269. [Google Scholar] [CrossRef] [PubMed]
- Harvey, M.; Pilgrim, S. The new competition for land: Food, energy, and climate change. Food Policy 2011, 36, S40–S51. [Google Scholar] [CrossRef]
- Choi, C.S.; Siregar, I.Z.; Ravi, S. Reframing the Competition for Land between Food and Energy Production in Indonesia. In Land Cover and Land Use Change on Islands: Social & Ecological Threats to Sustainability; Walsh, S.J., Riveros-Iregui, D., Arce-Nazario, J., Page, P.H., Eds.; Springer International Publishing: New York, NY, USA, 2020; pp. 241–260. [Google Scholar] [CrossRef]
- Hargreaves, J. Pond Mixing; Southern Regional Aquaculture Center. 2003. Available online: http://aquaculture.ca.uky.edu/sites/aquaculture.ca.uky.edu/files/srac_4602_pond_mixing.pdf (accessed on 7 July 2020).
- Oberle, M.; Salomon, S.; Ehrmaier, B.; Richter, P.; Lebert, M.; Strauch, S.M. Diurnal stratification of oxygen in shallow aquaculture ponds in central Europe and recommendations for optimal aeration. Aquaculture 2019, 501, 482–487. [Google Scholar] [CrossRef]
- Lazur, A.M.; Britt, D.C. Pond Recirculating Production Systems; Southern Regional Aquaculture Center. 1997. Available online: http://fisheries.tamu.edu/files/2013/09/SRAC-Publication-No.-455-Pond-Recirculating-Production-Systems.pdf (accessed on 8 July 2020).
- Garrison, P.J.; Marshall, D.W.; Stremick-Thompson, L.; Cicero, P.L.; Dearlove, P.D. Effects of pier shading on littoral zone habitat and communities in Lakes Ripley and Rock, Jefferson County. Wis. Dep. Nat. Resour. 2005, PUB-SS-1006, 2–17. [Google Scholar]
- Kallis, G. The EU water framework directive: Measures and implications. Hydrol. Res. 2001, 3, 125–142. [Google Scholar] [CrossRef]
- Wilhelm, J.A.; Smith, R.G. Ecosystem services and land sparing potential of urban and peri-urban agriculture: A review. Renew. Agric. Food Syst. 2017, 33, 481–494. [Google Scholar] [CrossRef]
- Phalan, B. What Have We Learned from the Land Sparing-sharing Model? Sustainability 2018, 10, 1760. [Google Scholar] [CrossRef] [Green Version]
- Macknick, J.; Beatty, B.; Hill, G. Overview of Opportunities for Co-Location of Solar Energy Technologies and Vegetation (NREL/TP-6A20-60240); National Renewable Energy Laboratory: Golden, CO, USA, 2013. [Google Scholar]
- Walston, L.J.; Mishra, S.K.; Hartmann, H.M.; Hlohowskyj, I.; McCall, J.; Macknick, J. Examining the Potential for Agricultural Benefits from Pollinator Habitat at Solar Facilities in the United States. Environ. Sci. Technol. 2018, 52, 7566–7576. [Google Scholar] [CrossRef]
- Hoffacker, M.K.; Allen, M.F.; Hernandez, R. Land-Sparing Opportunities for Solar Energy Development in Agricultural Landscapes: A Case Study of the Great Central Valley, CA, United States. Environ. Sci. Technol. 2017, 51, 14472–14482. [Google Scholar] [CrossRef] [Green Version]
- Dubey, S.; Jadhav, N.Y.; Zakirova, B. Socio-economic and environmental impacts of silicon based photovoltaic (PV) technologies. Energy Procedia 2013, 33, 322–334. [Google Scholar] [CrossRef] [Green Version]
- Fthenakis, V.; Kim, H.C. Land use and electricity generation: A life-cycle analysis. Renew. Sustain. Energy Rev. 2009, 13, 1465–1474. [Google Scholar] [CrossRef] [Green Version]
- Horner, R.M.; Clark, C.E. Characterizing variability and reducing uncertainty in estimates of solar land use energy intensity. Renew. Sustain. Energy Rev. 2013, 23, 129–137. [Google Scholar] [CrossRef]
- Ong, S.; Campbell, C.; Denholm, P.; Margolis, R.; Heath, G. Land-Use Requirements for Solar Power Plants in the United States (NREL/TP-6A20-56290); National Renewable Energy Laboratory (NREL): Golden, CO, USA, 2013. [Google Scholar]
- Elliott-Fisk, D.L. Viticultural soils of California, with special reference to the Napa valley. J. Wine Res. 1993, 4, 67–77. [Google Scholar] [CrossRef]
- Severy, C.L.; Thompson, R.M. Coalmont Area, Jackon County, Colorado; Wyoming Geological Association. 1953. Available online: http://archives.datapages.com/data/wga/data/008/008001/139_wga0080139.htm (accessed on 10 July 2020).
- PRISM Climate Group. Oregon State University. Available online: http://prism.oregonstate.edu (accessed on 2 April 2020).
- PRISM Descriptions of {PRISM} spatial climate datasets for the conterminous United States. Available online: https://prism.oregonstate.edu/documents/PRISM_datasets.pdf (accessed on 2 April 2020).
- Sharp Electronics Corporation. Sharp Multi-purpose Module {ND}-208U2. Available online: https://www.altestore.com/static/datafiles/Others/Sharp_208U2.pdf (accessed on 8 July 2020).
- Risen Energy. Risen Solar Technology: High performance Monocrystalline Perc Module: {RSM} 144-6-360M-380M/5BB. Available online: https://en.risenenergy.com/uploadfile/201808/215504a664.pdf (accessed on 7 July 2020).
- Jinko Solar. Eagle 1500V 72 340-360 Watt {MonoCrystalline} Module. Available online: http://jinkosolar.com.au/wp-content/uploads/2019/03/Eagle-JKM340-360M-72H-V-A2-EN.pdf (accessed on 8 July 2020).
- ReneSola Ltd. Virtus® {II} Module: 305W/310W/315W/320W. Available online: http://www.renesola.com/file/Global/product/pdf/Virtus%20II%20305-320(4035)%204BB%201000V%20US%201606.pdf (accessed on 6 July 2020).
- Bartle, C.; Harter, S. Webinar- Kelseyville Wastewater Treatment Plant. Available online: https://betterbuildingssolutioncenter.energy.gov/sites/default/files/tools/Floating%20Solar%20C&T_DOE%20Webinar_CB_032219.pptx%203%202019.pdf (accessed on 22 June 2020).
- Kunii, H.; Maeda, K. Seasonal and long-term changes in surface cover of aquatic plants in a shallow pond, Ojaga-ike, Chiba, Japan. Hydrobiologia 1982, 87, 45–55. [Google Scholar] [CrossRef]
- Tanny, J.; Cohen, S.; Berger, D.; Teltch, B.; Mekhmandarov, Y.; Bahar, M.; Katul, G.; Assouline, S. Evaporation from a reservoir with fluctuating water level: Correcting for limited fetch. J. Hydrol. 2011, 404, 146–156. [Google Scholar] [CrossRef]
- Wirth, M.A. Shape Analysis and Measurement. Ph.D. Thesis, University of Guelph Computing and Information Science Image Processing Group, Guelph, ON, Canada, 2001. [Google Scholar]
- Harrington, S.; Teitelman, J.; Rummel, E.; Morse, B.; Chen, P.; Eisentraut, D.; McDonough, D. Validating Google Earth Pro as a Scientific Utility for Use in Accident Reconstruction. SAE Int. J. Transp. Saf. 2017, 5, 135–166. [Google Scholar] [CrossRef]
- Johnson Controls. Personal communication. 2020. [Google Scholar]
- Ciel et Terre. Available online: https://www.ciel-et-terre.net/ (accessed on 31 August 2020).
- Santangeli, A.; Toivonen, T.; Pouzols, F.M.; Pogson, M.; Hastings, A.; Smith, P.; Moilanen, A. Global change synergies and trade-offs between renewable energy and biodiversity. GCB Bioenergy 2015, 8, 941–951. [Google Scholar] [CrossRef] [Green Version]
- Geels, F.W.; Schot, J. Typology of sociotechnical transition pathways. Res. Policy 2007, 36, 399–417. [Google Scholar] [CrossRef]
- Fuso Nerini, F.; Sovacool, B.; Hughes, N.; Cozzi, L.; Cosgrave, E.; Howells, M.; Tavoni, M.; Tomei, J.; Zerriffi, H.; Milligan, B. Connecting climate action with other Sustainable Development Goals. Nat. Sustain. 2019, 2, 674–680. [Google Scholar] [CrossRef]
- Battaglia, C.; Cuevas, A.; De Wolf, S. High-efficiency crystalline silicon solar cells: Status and perspectives. Energy Environ. Sci. 2016, 9, 1552–1576. [Google Scholar] [CrossRef] [Green Version]
- Lee, N.; Grunwald, U.; Rosenlieb, E.; Mirletz, H.; Aznar, A.; Spencer, R.; Cox, S. Hybrid floating solar photovoltaics-hydropower systems: Benefits and global assessment of technical potential. Renew. Energy 2020, 162, 1415–1427. [Google Scholar] [CrossRef]
- Liber, W.; Bartle, C.; Spencer, R.; Jordan, M.; Cagle, A.E.; Lewis, T. Statewide Potential Study for the Implementation of Floating Solar Photovoltaic Arrays; Colorado Energy Office: Denver, CO, USA, 2019. [Google Scholar]
- Farfan, J.; Breyer, C. Combining Floating Solar Photovoltaic Power Plants and Hydropower Reservoirs: A Virtual Battery of Great Global Potential. Energy Procedia 2018, 155, 403–441. [Google Scholar] [CrossRef]
- Gitau, P.; Ndiritu, G.; Gichuki, N. Ecological, recreational and educational potential of a small artificial wetland in an urban environment. Afr. J. Aquat. Sci. 2019, 44, 329–338. [Google Scholar] [CrossRef]
- Shepherd, N.L.; Nairn, R. Metals retention in a net alkaline mine drainage impacted stream due to the colonization of the North American Beaver (Castor canadensis). Sci. Total. Environ. 2020, 731, 139203. [Google Scholar] [CrossRef]
- Wu, J.S.; Holman, R.E.; Dorney, J.R. Systematic Evaluation of Pollutant Removal by Urban Wet Detention Ponds. J. Environ. Eng. 1996, 122, 983–988. [Google Scholar] [CrossRef]
- Cole, J.J.; Prairie, Y.T.; Caraco, N.F.; McDowell, W.H.; Tranvik, L.J.; Striegl, R.G.; Duarte, C.M.; Kortelainen, P.; Downing, J.A.; Middelburg, J.J.; et al. Plumbing the Global Carbon Cycle: Integrating Inland Waters into the Terrestrial Carbon Budget. Ecosystems 2007, 10, 172–185. [Google Scholar] [CrossRef] [Green Version]
- Raymond, P.A.; Hartman, J.; Lauerwald, R.; Sobek, S.; McDonald, C.P.; Hoover, M.; Butman, D.; Striegl, R.; Mayorga, E.; Humborg, C.; et al. Global carbon dioxide emissions from inland waters. Nature 2013, 503, 355–359. [Google Scholar] [CrossRef] [Green Version]
- Lehner, B.; Liermann, C.R.; Revenga, C.; Vörösmarty, C.; Fekete, B.; Crouzet, P.; Döll, P.; Endejan, M.; Frenken, K.; Magome, J.; et al. High-resolution mapping of the world’s reservoirs and dams for sustainable river-flow management. Front. Ecol. Environ. 2011, 9, 494–502. [Google Scholar] [CrossRef] [Green Version]
- Downing, J.A.; Prairie, Y.T.; Cole, J.J.; Duarte, C.M.; Tranvik, L.J.; Striegl, R.G.; McDowell, W.H.; Kortelainen, P.; Caraco, N.F.; Melack, J.M. The global abundance and size distribution of lakes, ponds, and impoundments. Limnol. Oceanogr. 2006, 51, 2388–2397. [Google Scholar] [CrossRef] [Green Version]
- Downing, J.A. Emerging global role of small lakes and ponds: Little things mean a lot. Limnetica 2010, 29, 0009–0024. [Google Scholar]
- Léonard, R.; Legendre, P.; Jean, M.; Bouchard, A. Using the landscape morphometric context to resolve spatial patterns of submerged macrophyte communities in a fluvial lake. Landsc. Ecol. 2007, 23, 91–105. [Google Scholar] [CrossRef]
- Sassolas-Serrayet, T.; Cattin, R.; Ferry, M. The shape of watersheds. Nat. Commun. 2018, 9, 3791. [Google Scholar] [CrossRef] [Green Version]
- Amiri, B.J.; Baheri, B.; Fohrer, N.; Adamowski, J.F. Regionalization of flood magnitudes using the ecological attributes of watersheds. Geocarto Int. 2019, 35, 917–933. [Google Scholar] [CrossRef]
- Eadie, J.M.; Keast, A. Resource heterogeneity and fish species diversity in lakes. Can. J. Zool. 1984, 62, 1689–1695. [Google Scholar] [CrossRef]
- Fuentes-Rodríguez, F.; Juan, M.; Gallego, I.; Lusi, M.; Fenoy, E.; Leon, D.; Peñalver, P.; Toja, J.; Casas, J.J. Diversity in Mediterranean farm ponds: Trade-offs and synergies between irrigation modernisation and biodiversity conservation. Freshw. Boil. 2012, 58, 63–78. [Google Scholar] [CrossRef]
- Steele, M.K.; Heffernan, J.B. Morphological characteristics of urban water bodies: Mechanisms of change and implications for ecosystem function. Ecol. Appl. 2014, 24, 1070–1084. [Google Scholar] [CrossRef]
- Krivtsov, V.; Birkinshaw, S.; Arthur, S.; Knott, D.; Monfries, R.; Wilson, K.; Christie, D.; Chamberlain, D.; Brownless, P.; Kelly, D.; et al. Flood resilience, amenity and biodiversity benefits of an historic urban pond. Philos. Trans. R. Soc. 2020, 378, 20190389. [Google Scholar] [CrossRef] [Green Version]
- Song, K.; Xenopoulos, M.A.; Buttle, J.M.; Marsalek, J.; Wagner, N.D.; Pick, F.R.; Frost, P.C. Thermal stratification patterns in urban ponds and their relationships with vertical nutrient gradients. J. Environ. Manag. 2013, 127, 317–323. [Google Scholar] [CrossRef] [PubMed]
- Gao, H.; Bohn, T.J.; Podest, E.; McDonald, K.C.; Lettenmaier, D.P. On the causes of the shrinking of Lake Chad. Environ. Res. Lett. 2011, 6, 034021. [Google Scholar] [CrossRef] [Green Version]
- Huang, L.; Liu, J.; Shao, Q.; Liu, R. Changing inland lakes responding to climate warming in Northeastern Tibetan Plateau. Clim. Chang. 2011, 109, 479–502. [Google Scholar] [CrossRef]
- Wurtsbaugh, W.A.; Miller, C.; Null, S.E.; Derose, R.J.; Wilcock, P.; Hahnenberger, M.; Howe, F.; Moore, J. Decline of the world’s saline lakes. Nat. Geosci. 2017, 10, 816–821. [Google Scholar] [CrossRef]
- De Anda, J.; Díaz-Torres, J.D.J.; Gradilla-Hernández, M.S.; De La Torre-Castro, L.M. Morphometric and water quality features of Lake Cajititlán, Mexico. Environ. Monit. Assess. 2019, 191, 92. [Google Scholar] [CrossRef] [PubMed]
- Jones, B.A.; Fleck, J. Shrinking lakes, air pollution, and human health: Evidence from California’s Salton Sea. Sci. Total. Environ. 2020, 712, 136490. [Google Scholar] [CrossRef] [PubMed]
- Ho, J.C.; Michalak, A.M.; Pahlevan, N. Widespread global increase in intense lake phytoplankton blooms since the 1980s. Nature 2019, 574, 667–670. [Google Scholar] [CrossRef]
- Ribeiro, A.E.D.; Arouca, M.C.; Coelho, D.M. Electric energy generation from small-scale solar and wind power in Brazil: The influence of location, area and shape. Renew. Energy 2016, 85, 554–563. [Google Scholar] [CrossRef]
- Bordas, A. Windsor plans to use floating solar panel system to power town’s public water facilities. 2019. in press. Available online: https://www.pressdemocrat.com/article/news/windsor-plans-to-use-floating-solar-panel-system-to-power-towns-public-wat/ (accessed on 14 July 2020).
- Flynn, D.F.B.; Gogol-Prokurat, M.; Nogeire, T.; Molinari, N.; Richers, B.T.; Lin, B.; Simpson, N.; Mayfield, M.M.; Declerck, F. Loss of functional diversity under land use intensification across multiple taxa. Ecol. Lett. 2009, 12, 22–33. [Google Scholar] [CrossRef]
- Drummond, M.A.; Loveland, T.R. Land-use Pressure and a Transition to Forest-cover Loss in the Eastern United States. Bioscience 2010, 60, 286–298. [Google Scholar] [CrossRef]
- Brovkin, V.; Boysen, L.; Arora, V.K.; Boisier, J.P.; Cadule, P.; Chini, L.; Claussen, M.; Friedlingstein, P.; Gayler, V.; Hurk, B.J.J.M.V.D.; et al. Effect of Anthropogenic Land-Use and Land-Cover Changes on Climate and Land Carbon Storage in CMIP5 Projections for the Twenty-First Century. J. Clim. 2013, 26, 6859–6881. [Google Scholar] [CrossRef]
- Bryden, J. Renewable Energy as a Rural Development Opportunity; NILF Discussion Papers: Oslo, Norway, 2010. [Google Scholar]
- Capellán, I.; De Castro, C.; Arto, I. Assessing vulnerabilities and limits in the transition to renewable energies: Land requirements under 100% solar energy scenarios. Renew. Sustain. Energy Rev. 2017, 77, 760–782. [Google Scholar] [CrossRef] [Green Version]
- Johnson Controls. Personal communications. 2020. [Google Scholar]
- Mulvaney, D. Identifying the roots of Green Civil War over utility-scale solar energy projects on public lands across the American Southwest. J. Land Use Sci. 2017, 12, 493–515. [Google Scholar] [CrossRef]
- Welton, S.; Eisen, J. Clean Energy Justice: Charting an Emerging Agenda. Harv. Environ. Law Rev. 2019, 43, 307. [Google Scholar]
- Parker, S.S.; Pauly, G.B.; Moore, J.; Fraga, N.S.; Knapp, J.J.; Principe, Z.; Brown, B.V.; Randall, J.M.; Cohen, B.S.; Wake, T.A. Adapting the bioblitz to meet conservation needs. Conserv. Boil. 2018, 32, 1007–1019. [Google Scholar] [CrossRef] [Green Version]
- Murphy-Mariscal, M.; Grodsky, S.M.; Hernandez, R.R. Solar Energy Development and the Biosphere. In A Comprehensive Guide to Solar Energy Systems; Academic Press: London, UK, 2018; pp. 391–405. [Google Scholar]
- Silliman, B.R.; Bertness, M.D. Shoreline Development Drives Invasion of Phragmites australis and the Loss of Plant Diversity on New England Salt Marshes. Conserv. Biol. 2004, 18, 1424–1434. [Google Scholar] [CrossRef]
- Sundblad, G.; Bergström, U. Shoreline development and degradation of coastal fish reproduction habitats. Ambio 2014, 43, 1020–1028. [Google Scholar] [CrossRef] [Green Version]
- Garone, P. The Fall and Rise of the Wetlands of California’s Great Central Valley; University of California Press: Oakland, CA, USA, 2020. [Google Scholar]
- Alcott, B. Jevons’ paradox. Ecol. Econ. 2005, 54, 9–21. [Google Scholar] [CrossRef]
- Garcia, V.R.; Gaspart, F.; Kastner, T.; Meyfroidt, P. Agricultural intensification and land use change: Assessing country-level induced intensification, land sparing and rebound effect. Environ. Res. Lett. 2020, 15, 085007. [Google Scholar] [CrossRef]
- Dupraz, C.; Marrou, H.; Talbot, G.; Dufour, L.; Nogier, A.; Ferard, Y. Combining solar photovoltaic panels and food crops for optimising land use: Towards new agrivoltaic schemes. Renew. Energy 2011, 36, 2725–2732. [Google Scholar] [CrossRef]
- Amaducci, S.; Yin, X.; Colauzzi, M. Agrivoltaic systems to optimise land use for electric energy production. Appl. Energy 2018, 220, 545–561. [Google Scholar] [CrossRef]
- Othman, M.N.A.; Hassan, R.; Harith, M.N.; Sah, A.S.R.M. Red Seaweed Gracilaria Arcuata in Cage Culture Area of Lawas, Sarawak. Borneo J. Resour. Sci. Technol. 2015, 5, 53–61. [Google Scholar] [CrossRef] [Green Version]
- Bychkov, I.V.; Gagarinova, O.V.; Maksimova, I.I.; Bogdanov, V.N. Water Protection Zoning as an Instrument of Preservation for Lake Baikal. Water 2018, 10, 1474. [Google Scholar] [CrossRef] [Green Version]
- Doris Group Hibernia. Available online: https://www.dorisgroup.com/projets/hibernia/ (accessed on 9 August 2020).
- Muehlenbachs, L.; Cohen, M.A.; Gerarden, T. The impact of water depth on safety and environmental performance in offshore oil and gas production. Energy Policy 2013, 55, 699–705. [Google Scholar] [CrossRef]
- Phillips, M.; Subasinghe, R.P.; Tran, N.; Kassam, L.; Chan, C.Y. Aquaculture Big Numbers; Food and Agriculture Organization of the United Nations: Rome, Italy, 2016. [Google Scholar]
- Lovering, J.; Swain, M.; Blomqvist, L.; Hernandez, R.R. Land-use intensity of electricity production and tomorrow’s energy landscape. status (unpublished; manuscript in preparation).
- Cagle, A.; Hernandez, R.R.; Shepherd, M.; Cagle, A.; Hernandez, R.R.; Shepherd, M. Solar Energy Development in an Era of Looming Land Scarcity: Land-Use Metric Standardization and Novel Concepts. AGUFM 2019, 2019, GC53I-1206. [Google Scholar]
- Koho, M.; Torvinen, S.; Romiguer, A.T. Objectives, enablers and challenges of sustainable development and sustainable manufacturing: Views and opinions of Spanish companies. In Proceedings of the 2011 IEEE International Symposium on Assembly and Manufacturing (ISAM), Tampere, Finland, 25–27 May 2011. [Google Scholar]
- Lausch, A.; Blaschke, T.; Haase, D.; Herzog, F.; Syrbe, R.-U.; Tischendorf, L.; Walz, U. Understanding and quantifying landscape structure – A review on relevant process characteristics, data models and landscape metrics. Ecol. Model. 2015, 295, 31–41. [Google Scholar] [CrossRef]
- Grubert, E.; Rogers, E.; Sanders, K.T. Consistent Terminology and Reporting Are Needed to Describe Water Quantity Use. J. Water Resour. Plan. Manag. 2020, 146, 04020064. [Google Scholar] [CrossRef]
- DeFries, R.S.; Fanzo, J.; Remans, R.; Palm, C.; Wood, S.A.; Anderman, T.L. Metrics for land-scarce agriculture. Science 2015, 349, 238–240. [Google Scholar] [CrossRef]
- Google Earth Pro v 7.3.2.5776 (64-bit). Windsor, California. 38°32′22.09″N 122°48′52.5″W elev. 92ft. eye alt 1,413ft. CNES/Airbus 2020. (11/7/2019). Available online: https://earth.google.com/ (accessed on 13 April 2020).
- Google Earth Pro v 7.3.2.5776 (64-bit). Windsor, California. 38°32′22.09″N 122°48′52.5″W elev. 92ft. eye alt 1,413ft. Maxar Technologies 2020. (3/28/2018). Available online: https://earth.google.com/ (accessed on 13 April 2020).
- Google Earth Pro v 7.3.2.5776 (64-bit). Windsor, California. 38°32′22.09″N 122°48′52.5″W elev. 92ft. eye alt 1,413ft. Maxar Technologies 2020. (7/28/2019). Available online: https://earth.google.com/ (accessed on 13 April 2020).
- Google Earth Pro v 7.3.2.5776 (64-bit). Windsor, California. 38°32′22.09″N 122°48′52.5″W elev. 92ft. eye alt 1,413ft. Maxar Technologies 2020. (10/23/2019). Available online: https://earth.google.com/ (accessed on 13 April 2020).
- Google Earth Pro v 7.3.2.5776 (64-bit). Oakville, California. 38°25′18.16″N 122°24′31.40″W elev 216 ft. eye alt 1,139 ft. Maxar Technologies 2020. (9/1/2018). Available online: https://earth.google.com/ (accessed on 13 April 2020).
- Google Earth Pro v 7.3.2.5776 (64-bit). Oakville, California. 38°25′18.16″N 122°24′31.40″W elev 216 ft. eye alt 1,139 ft. Maxar Technologies 2020. (2/5/2018). Available online: https://earth.google.com/ (accessed on 13 April 2020).
- Google Earth Pro v 7.3.2.5776 (64-bit). Oakville, California. 38°25′18.16″N 122°24′31.40″W elev 216 ft. eye alt 1,139 ft. Maxar Technologies 2020. (3/16/2016). Available online: https://earth.google.com/ (accessed on 13 April 2020).
- Google Earth Pro v 7.3.2.5776 (64-bit). Oakville, California. 38°25′18.16″N 122°24′31.40″W elev 216 ft. eye alt 1,139 ft. Maxar Technologies 2020. (5/20/2017). Available online: https://earth.google.com/ (accessed on 13 April 2020).
- Google Earth Pro v 7.3.2.5776 (64-bit). Orlando, Florida. 28°30′08.67″N 81°25′18.15″W. elev 103ft. eye alt 1,401ft. Landsat/Copernicus 2020. (12/17/2018). Available online: https://earth.google.com/ (accessed on 13 April 2020).
- Google Earth Pro v 7.3.2.5776 (64-bit). Orlando, Florida. 28°30′08.67″N 81°25′18.15″W. elev 103ft. eye alt 1,401ft. Maxar Technologies 2020. (5/8/2016). Available online: https://earth.google.com/ (accessed on 13 April 2020).
- Google Earth Pro v 7.3.2.5776 (64-bit). Orlando, Florida. 28°30′08.67″N 81°25′18.15″W. elev 103ft. eye alt 1,401ft. Landsat/Copernicus 2020. (5/6/2017). Available online: https://earth.google.com/ (accessed on 13 April 2020).
- Google Earth Pro v 7.3.2.5776 (64-bit). Orlando, Florida. 28°30′08.67″N 81°25′18.15″W. elev 103ft. eye alt 1,401ft. Landsat/Copernicus 2020. (1/3/2018). Available online: https://earth.google.com/ (accessed on 13 April 2020).
- Google Earth Pro v 7.3.2.5776 (64-bit). Walden, Colorado. 40°44″24.70″N 106°16′50.82″W. elev 8,065. eye alt 8,349ft. Landsat/Copernicus 2020. (9/7/2016). Available online: https://earth.google.com/ (accessed on 13 April 2020).
- Google Earth Pro v 7.3.2.5776 (64-bit). Walden, Colorado. 40°44″24.70″N 106°16′50.82″W. elev 8,065. eye alt 8,349ft. Landsat/Copernicus 2020. (8/26/2019). Available online: https://earth.google.com/ (accessed on 13 April 2020).
- Google Earth Pro v 7.3.2.5776 (64-bit). Walden, Colorado. 40°44″24.70″N 106°16′50.82″W. elev 8,065. eye alt 8,349ft. Maxar Technologies 2020. (9/17/2015). Available online: https://earth.google.com/ (accessed on 13 April 2020).
- Google Earth Pro v 7.3.2.5776 (64-bit). Walden, Colorado. 40°44″24.70″N 106°16′50.82″W. elev 8,065. eye alt 8,349ft. Landsat/Copernicus 2020. (6/18/2014). Available online: https://earth.google.com/ (accessed on 13 April 2020).


| Technological Attribute | Location | ||||
|---|---|---|---|---|---|
| Oakville, CA | Windsor, CA | Walden, CO | Orlando, FL | Mean | |
| Installation capacity (kWp) | 206 | 1,780 | 74 | 31.5 | 522.8 |
| Number of PV panels in installation | 994 | 4,959 | 208 | 100 | 1,566 |
| Age of FPV system as of March 2020 (years) | 12 | 1 | 2 | 3 | 4.5 |
| PV panel technology | Sharp ND-208U2 | Risen Energy RSM72-6-360M | Jinko 355W | Renesola JC315M-315W | N/A |
| Panel efficiency | 12.8% | 18.6% | 18.3% | 16.2% | 16.5% |
| Floatation device type | Custom Manufacture | Hydrelio 1 | Hydrelio 1 | Hydrelio 1 | N/A |
| Panel tilt | 22° | 12° | 12° | 12° | 14.5° |
| Hydrological Attributes | Location | ||||
|---|---|---|---|---|---|
| Oakville, CA | Windsor, CA | Walden, CO | Orlando, FL | Mean | |
| Managed inputs | yes (1) | yes (1) | yes (1) | no (0) | 0.75 ± 0.5 |
| Water body type | Irrigation pond | Water treatment holding pond | Water treatment holding pond | Storm water run-off pond | — |
| Water depth (m) | 3.4 | —* | 1 | 3 | 2.5 * |
| Water body perimeter (m) | 263 ± 5.4 | 1086 ± 11.1 | 139 ±10.8 | 589 ± 40.4 | 519 ± 422.7 |
| FPV System Components | Spatial Attributes | Location | ||||
|---|---|---|---|---|---|---|
| Oakville, CA | Windsor, CA | Walden, CO | Orlando, FL | Mean (± 1 SD) | ||
| FPV | Surface area of FPV installation (m2) | 3,143 | 16,184 | 700 | 359 | 5,097 ± 7,495 |
| Shore-based land use of BOS1 (% of direct FPV area) | 0.3 | 0.1 | 0.6 | 1.9 | 0.7 ± 0.8 | |
| Packing factor | 0.51 | 0.59 | 0.57 | 0.54 | 0.55 ± 0.04 | |
| FPV installation compactness | 0.74 | 0.68 | 0.68 | 0.76 | 0.72 ± 0.04 | |
| Water Body | Water body surface area (m2)) | 4,512 ± 243 | 69,452 ± 2,110 | 1,110 ± 34 | 11,773 ± 458 | 21,712 ± 32,136 |
| Water body compactness | 0.823 | 0.741 | 0.722 | 0.426 | 0.68 ± 0.17 | |
| Water body roundness | 0.87 | 0.78 | 0.79 | 0.67 | 0.78 ± 0.08 | |
| Water body eccentricity | 0.92 | 0.76 | 0.75 | 0.71 | 0.78 ± 0.09 | |
| FPV and Water Body | Percent water surface covered | 69.8 ± 4.0 | 23.3 ± 0.7 | 63.1 ± 1.9 | 3.1 ± 0.1 | 39.8 ± 28.7 |
| Location | |||||
|---|---|---|---|---|---|
| Resource Use Metric | Oakville, CA | Windsor, CA | Walden, CO | Orlando, FL | Mean (± 1 SD) |
| FPV sited to spare land | yes | yes | yes | no | — |
| Land sparing (m2) | 5,859 | 50,702 | 2,104 | 891 | 14,889 ± 23,969 |
| Land sparing Ratio (LSR) (m2: m2) | 1.9:1 | 3.1:1 | 3.0:1 | 2.7:1 | 2.7:1 |
| Direct WSUE (W m−2) | 65.5 | 110 | 105.7 | 96.9 | 94.5 ± 20.1 |
| Total WSUE (W m−2) | 45.7 | 25.6 | 66.7 | 2.7 | 35.2 ± 27.4 |
| Direct WST (m2 MWh−1 yr−1) | 9.3 | — | — | — | — |
| Total WST (m2 MWh−1 yr−1) | 13.4 | — | — | — | — |
© 2020 by the authors. Licensee MDPI, Basel, Switzerland. This article is an open access article distributed under the terms and conditions of the Creative Commons Attribution (CC BY) license (http://creativecommons.org/licenses/by/4.0/).
Share and Cite
Cagle, A.E.; Armstrong, A.; Exley, G.; Grodsky, S.M.; Macknick, J.; Sherwin, J.; Hernandez, R.R. The Land Sparing, Water Surface Use Efficiency, and Water Surface Transformation of Floating Photovoltaic Solar Energy Installations. Sustainability 2020, 12, 8154. https://doi.org/10.3390/su12198154
Cagle AE, Armstrong A, Exley G, Grodsky SM, Macknick J, Sherwin J, Hernandez RR. The Land Sparing, Water Surface Use Efficiency, and Water Surface Transformation of Floating Photovoltaic Solar Energy Installations. Sustainability. 2020; 12(19):8154. https://doi.org/10.3390/su12198154
Chicago/Turabian StyleCagle, Alexander E., Alona Armstrong, Giles Exley, Steven M. Grodsky, Jordan Macknick, John Sherwin, and Rebecca R. Hernandez. 2020. "The Land Sparing, Water Surface Use Efficiency, and Water Surface Transformation of Floating Photovoltaic Solar Energy Installations" Sustainability 12, no. 19: 8154. https://doi.org/10.3390/su12198154