Executive Summary
The addition of a sexual orientation identity measure to the 2013 National Health Interview Survey (NHIS) offers a new data source to consider characteristics of families and explore differences among those led by same-sex and different-sex married and unmarried couples and LGB individuals who are not married or cohabiting. These analyses consider differences and similarities across these groups with regard to demographic characteristics including gender, age, race/ethnicity, educational attainment, geographic location, and child-rearing.
The analyses suggest that there are an estimated 690,000 same-sex couples in the United States. Approximately 18% of whom, or more than 124,000, reported that they were married. If estimates of married same-sex couples are derived only from the portion of 2013 that followed the US Supreme Court ruling in United States v. Windsor and are not based on data collected prior to the ruling (which effectively provided for federal recognition of the marriages of same-sex couples), then the estimate of married same-sex couples increases to 130,000.
Key Findings
- An estimated 4 in 10 LGB adults (40%) reported either being married or in a cohabiting relationship with a partner compared to 6 in 10 non-LGB adults (60%).
- Among women, more than half who identified as lesbian (51%) were married or in a cohabiting partnership compared to 57% of non-LGB women. Among bisexual women, the comparable figure was 32%.
- Just over a third of gay and bisexual men (35% and 34%, respectively) were coupled compared to 63% of non-LGB men.
- A higher proportion of same-sex couples lived in the West when compared to different-sex couples (32% v. 23%, respectively) while a lower portion lived in the Midwest (12% v. 23%, respectively). Among those not in a couple, LGB individuals were less likely than their non-LGB counterparts to live in the Midwest (15% v. 22%).
- Married same-sex couples were much more likely than their different-sex counterparts to live in the Northeast (39% v. 17%, respectively), where marriage for same-sex couples was the most widely available in 2013. An estimated 12% of married same-sex couples lived in the South compared to 38% of their different-sex counterparts.
- Unmarried same-sex couples were more likely than their unmarried different-sex couple counterparts to live in the West and less likely to live in the Midwest.
- Those in same-sex couples and LGB individuals who were not part of a couple were generally younger than their different-sex coupled and non-LGB counterparts, respectively.
- Same-sex couples were twice as likely as their different-sex counterparts to be inter-racial/ethnic (19% v. 9%, respectively).
- Those in same-sex couples, particularly married same-sex couples, and LGB individuals who were not in a couple were more likely than those in different-sex couples and non-LGB individuals, respectively, to have a college degree. Two-thirds of individuals in married same-sex couples (66%) had a college degree.
- An estimated 19% of same-sex couples and LGB individuals who were not in a couple were raising children under the age of 18 in the home.
- An estimated 30,000 children under age 18 have married same-sex parents while 170,000 have unmarried same-sex parents.
- Between 1.1 and 2 million children under age 18 have an LGB parent who is not part of a married or unmarried couple.
Introduction
Substantial demographic research exists focusing on analyses of cohabiting same-sex couples identified in US Census Bureau data (Black et al. 2000; Gates and Ost 2004; Gates and Cooke 2010; Baumle 2013; Kastanis and Wilson 2013). Unfortunately, the Census Bureau data do not provide a very accurate way to identify married same-sex couples (O’Connell and Feliz 2011; Gates and Steinberger 2009; Cohn 2014). Comparisons of demographic and geographic characteristics among those in married and unmarried same-sex couples along with lesbian, gay, or bisexual (LGB) individuals who do not have a spouse or cohabiting partner are relatively rare.
The addition of a sexual orientation identity measure to the 2013 National Health Interview Survey (NHIS) offers a new data source to consider characteristics of families and explore differences among those led by same-sex and different-sex married and unmarried couples and LGB individuals who are not married or cohabiting. These analyses consider differences and similarities across these groups with regard to demographic characteristics including gender, age, race/ethnicity, educational attainment, geographic location, and child-rearing.
Data and methodology
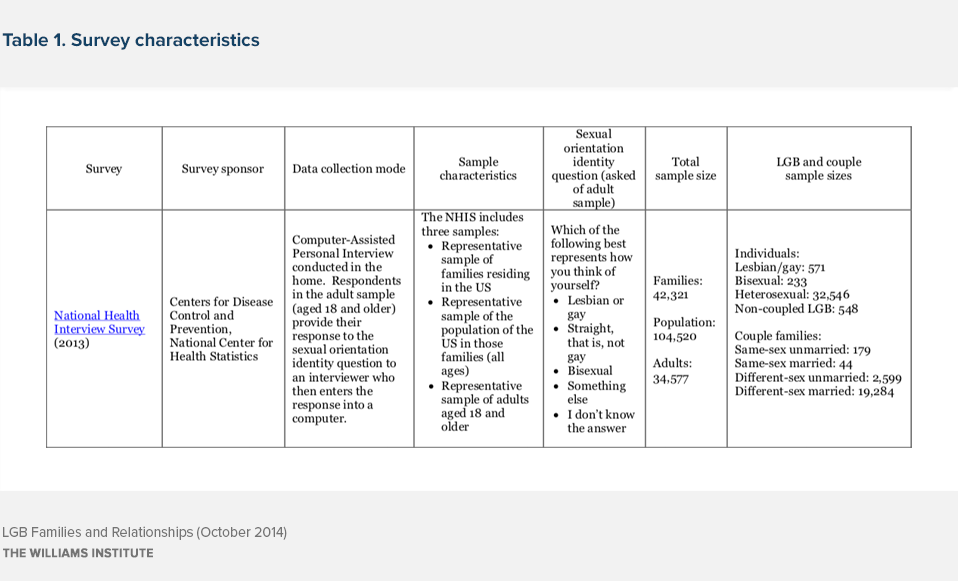
Table 1 presents details of the NHIS data used in these analyses. It is a publically-funded survey conducted by the National Center for Health Statistics (NCHS). The survey samples families in the US and collects information on all members of those families, including their relationship to a reference person identified in each family. It is this information that allows for the identification of families led by married and unmarried same-sex or different-sex couples. An adult-only sample (drawn from the family respondents) includes a question that allows respondents to describe their sexual orientation identity.
Analyses include descriptions of family characteristics (e.g., region of residence, child-rearing) and characteristics of individual adults (e.g., age, race/ethnicity, educational attainment, sexual orientation identity). Estimates use weighting procedures provided by the NHIS that allow for population estimates and interpretation of findings to be considered representative of families and the adult population (aged 18 and older) in the US.
In charts and figures that compare estimates between same-sex and different-sex couples or LGB and non-LGB adults, differences that are statistically significant are shown in boldface while differences that are not statistically different are shown in italics.
Marriage and Cohabitation
The NHIS data allow for the identification of the gender composition of couples among those who say that they are legally married or in a cohabiting partnership.
An estimated 4 in 10 LGB adults (40%) reported either being married or in a cohabiting relationship with a partner (see Figure 1) compared to 6 in 10 non-LGB adults (60%). However, coupling patterns differed by sexual orientation and gender.

Among women, more than half who identified as lesbian (51%) were married or in a cohabiting partnership compared to 57% of non-LGB women, a difference that was not statistically significant. Among bisexual women, the comparable figure was 32%. Just over a third of gay and bisexual men (35% and 34%, respectively) were coupled compared to 63% of non-LGB men.
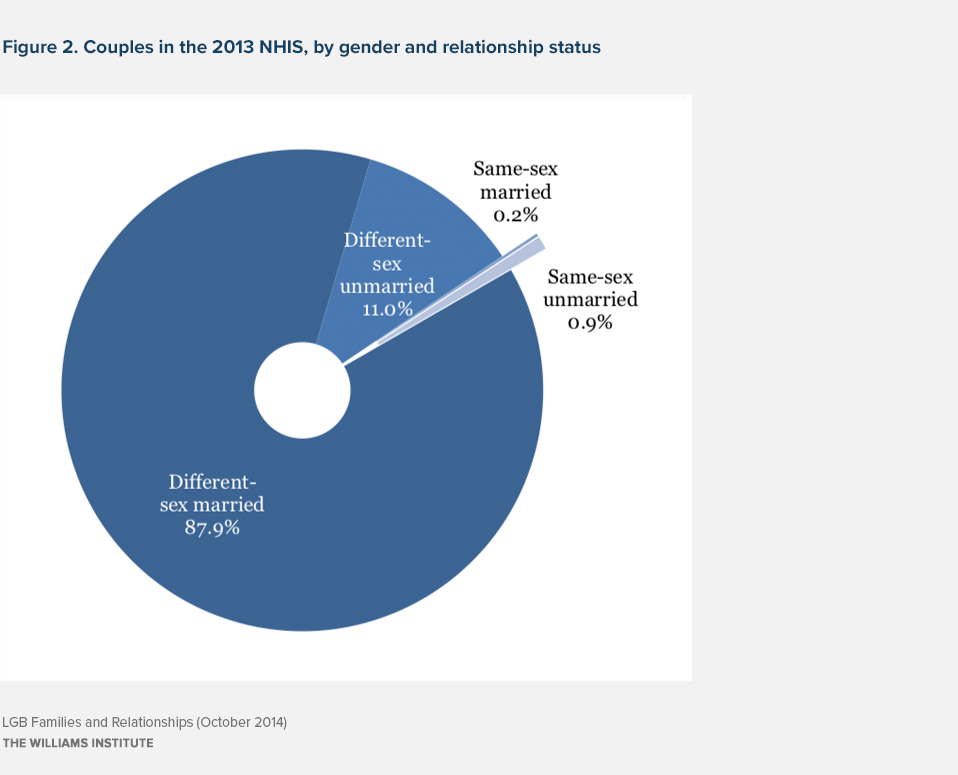
Just over half of the families in the US (52%) were led by a co-residential married or unmarried couple. Of families led by a couple, approximately 1.1% of the couples were same-sex (see Figure 2). This implies that there are approximately 64.6 million families in the United States and more than 690,000 same-sex couple families. Figures from Census 2010 showed approximately 650,000 same-sex couples in the United States at that time (Gates and Cooke 2011).
Of the estimated 690,000 same-sex couples in the United States, approximately 18%, or more than 124,000 same-sex couples, reported that they were married. It is important to note that the NHIS data collection occurred throughout 2013 and in June of that year, the US Supreme Court issued it’s ruling in United States v. Windsor which effectively provided for federal recognition of the marriages of same-sex couples. It is possible that the prospect of federal recognition and the many benefits and protections that accompany that recognition could have prompted many more same-sex couples to marry in the latter part of the year.
Among respondents who were surveyed prior to the Windsor decision (from January through June 2013), approximately 17% of same-sex couples indicated that they were married. Among respondents who were surveyed in the second half of the year (July through December 2013), after the Supreme Court ruling, the estimate was 19% of same-sex couples who were married. While the difference in these estimates was not statistically significant, it is notable that the proportion of married couples among different-sex couples (94%) did not vary at all in the two halves of the year.
If the estimate from the latter half of the year represents a more accurate assessment of the portion of same-sex couples who are legally married, then the figure may be closer to 130,000. These estimates would also imply that approximately one in ten (approximately 13,000) married same-sex couples may have gotten married after the Windsor decision.
Region of Residence
Comparing individuals in same-sex couples to different-sex couples, the analyses suggest differences in the geographic distribution across regions in the US (see Figure 3). A higher proportion of same-sex couples lived in the West when compared to different-sex couples (32% v. 23%, respectively) while a lower portion lived in the Midwest (12% v. 23%, respectively).

Differences in this pattern when comparing same-sex and different-sex married and unmarried couples to each other highlight the likely impact of regional variation in laws regarding availability and recognition of marriages for same-sex couples. In 2013, the Northeast was the region of the country where marriage for same-sex couples was the most widely available for the longest period of time. Not surprisingly, married same-sex couples were much more likely than their different-sex counterparts to live in this region (39% v. 17%, respectively). The South represents the region where residents were least likely to live in a state where marriages of same-sex couples were legal. Only 12% of married same-sex couples lived in the South compared to 38% of their different-sex counterparts.
Like same-sex couples more generally, unmarried same-sex couples were more likely than their unmarried different-sex couple counterparts to live in the West and less likely to live in the Midwest. Among those not in a couple, LGB individuals were less likely than their non-LGB counterparts to live in the Midwest (15% v. 22%).
Age, Race/Ethnicity, and Educational Attainment
Among those in couples, individuals in same-sex couples were, on average, more than five years younger than those in different-sex couples (see Table 1). However, the difference in average age between individuals in married same-sex and different-sex couples was not statistically significant. Among unmarried couples, those in different-sex couples were nearly five years younger than those in same-sex couples. Among those who were not in a couple, LGB individuals were, on average, more than seven years younger than non-LGB individuals.
The analyses do not show significant differences in the portion of those in same-sex and different-sex married couples who were non-white nor were there significant differences in that characteristic between LGB and non-LGB individuals who were not in a couple. However, among unmarried couples, those in different-sex couples were more likely than their same-sex counterparts to be non-white (37% v. 24%, respectively).
Same-sex couples were more likely to be inter-racial/ethnic than their different-sex counterparts. Among all couples, same-sex couples were twice as likely as their different-sex counterparts to be inter-racial/ethnic (19% v. 9%, respectively). When couples were separated by marital status, the differences in the proportion who were inter-racial/ethnic were not statistically significant for either married or unmarried couples.
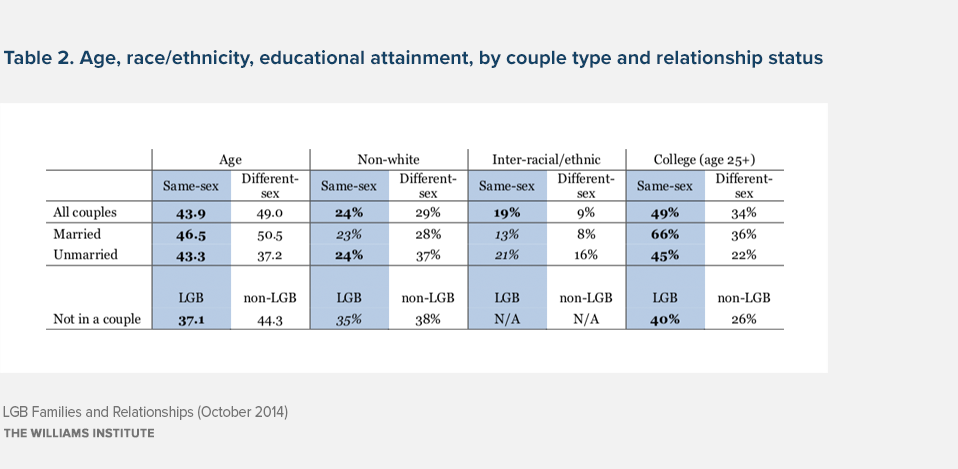
Those in same-sex couples and LGB individuals who were not in a couple and were aged 25 and older were more likely than those in different-sex couples and non-LGB individuals, respectively, to have a college degree. This is particularly true among married individuals. Two-thirds of individuals aged 25 and older who were part of a married same-sex couple (66%) had a college degree compared to just over one-third of those in married different-sex couples (36%). Among those not in a couple who were aged 25 and older, 40% of LGB individuals had a college degree compared to 26% of their non-LGB counterparts.
Raising Children
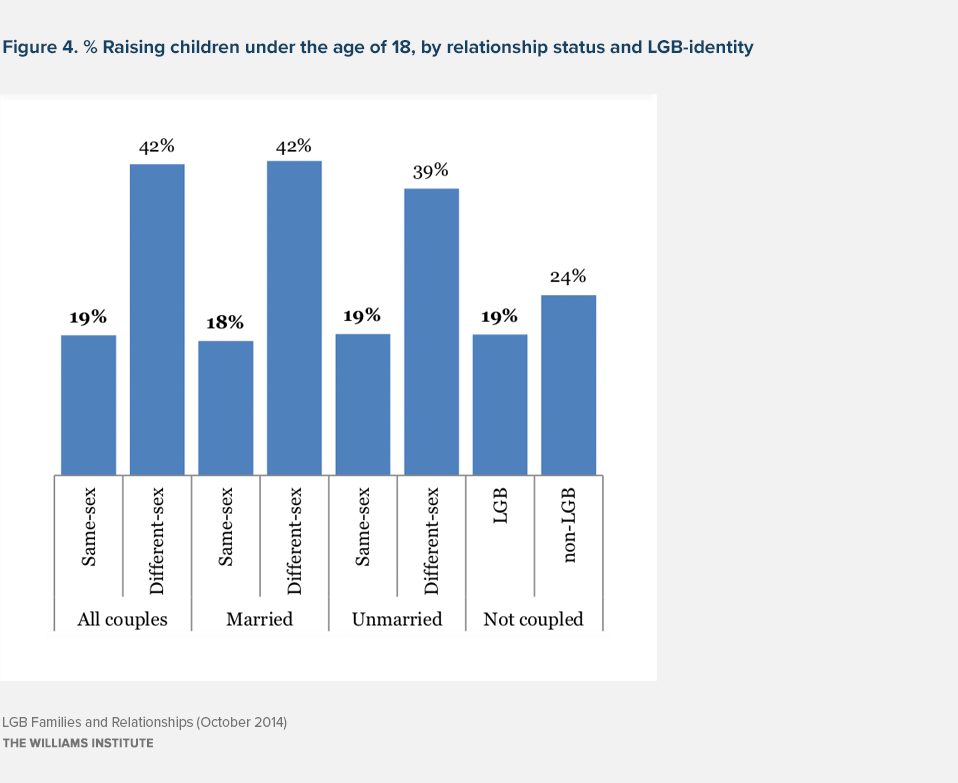
An estimated 19% of same-sex couples observed in the NHIS data were raising children under the age of 18 in the home (see Figure 4), lower than the 42% of different-sex couples who were raising children. The portion of LGB individuals who were not in a couple and reported raising children was also 19%. Among same-sex couples, similar portions of married and unmarried couples were raising children (18% and 19%, respectively).
Assuming the NHIS estimate of 690,000 same-sex couples, these figures imply that approximately 131,000 same-sex couples are raising children in the US. Among same-sex couples with children, there was an average of 1.5 children in the home, suggesting that nearly 200,000 children under the age of 18 are being raised by same-sex couples. Of these children, approximately 30,000 have married parents while 170,000 have unmarried parents.
An estimate for the number of LGB individuals who were not in a couple and raising children depends on what figure is used to estimate the overall proportion of LGB adults in the population. The estimate of LGB-identity among adults in the NHIS was 2.2%, which implies approximately 5.2 million LGB individuals (Gates 2014). If, consistent with the NHIS findings, 60% of these LGB individuals are not married or partnered, then the analyses would suggest that nearly 600,000 LGB adults who are not in a couple are raising more than 1.1 million children (on average, this group reported 1.9 children in the home).
Data from the Gallup Daily Tracking survey suggest that nearly 4% of adults identify as LGBT, implying that there are an estimated 9.5 million LGBT adults in the US (Gates 2014). Like the NHIS data, the Gallup data also show that about 60% of LGBT identified adults are not part of a married or unmarried couple. If the NHIS figures regarding relationship status and child-rearing are applied to the Gallup estimate, it would mean that more than a million LGBT adults who are not in a couple are raising approximately 2 million children.
These calculations suggest that the estimated number of adults in the US who are raising children under age 18 and are either in a married or unmarried same-sex couple or are LGB-identified and not in a couple is between 862,000 and 1.26 million. The estimates for the number of children being raised either by a same-sex couple or a non-coupled LGB parent are between 1.3 and 2.2 million.
In considering the total extent of parenting among LGB adults, it is important to consider that some LGB parents are raising children as part of a different-sex couple. This is particularly true for bisexual parents. Among bisexual adults with children, 51% were married with a different-sex spouse, 11% had a different-sex unmarried partner, and 4% had a same-sex spouse or partner. Among adults who identified as gay or lesbian and were raising children, 18% had a different-sex married spouse and 4% had a different-sex unmarried partner.
Among all LGB-identified adults, regardless of relationship status, NHIS analyses suggest that an estimated 23% were raising children under age 18 (20% among lesbians and gay men and 31% among bisexual men and women). Applying that figure to the NHIS and Gallup estimates of the size of the LGB and LGBT populations, respectively, implies that between 1.2 and 2.2 million LGBT adults in the US are raising from 2.0 to 3.7 million children.
Discussion
The 2013 NHIS data provide a rare opportunity to consider relationship and family status along with sexual orientation identity within the framework of a population-based survey. Many of the findings in these analyses are consistent with other research. These similarities include estimates of the number of same-sex couples, the proportion of those couples who are raising children, and demographic patterns with regard to age, race/ethnicity, inter-racial and ethnic coupling, and educational attainment.
Because of challenges associated with the measurement of same-sex couples in US Census Bureau data, estimates of the number of married same-sex couples in the US or their geographic distribution are difficult to obtain. Such estimates are further complicated by a legal landscape where the availability of marriage for same-sex couples across states is changing rapidly, as well as likely rapid changes in the number and location of married same-sex couples.
The NHIS data confirm that married same-sex couples live throughout the country, including in many states where their marriages may not be recognized. More than one in ten (12%) reported living in the South, where only Maryland and Washington, DC recognized their marriages.
The estimate of approximately 124,000 married same-sex couples (or the 130,000 estimate derived by using only data from the second half of 2013) offers evidence of substantial change in the last few years.
As of 2010, Badgett and Herman (2011) estimated that about 50,000 same-sex couples had married in the US. A survey conducted in that same year by the Williams Institute suggested that the total number of married same-sex couples in that year (including couples married outside of the US) may have been as high as 80,000. Even under an assumption using the conservative estimate of 124,000 marriages, these figures suggest that the population of married same-sex couples in the US has grown by more than 50% in only three years.
Download the brief