Redistricting Colorado
What can we learn from how people have been grouped together in voting districts over the past 145 years?
As Colorado’s experiment in nonpartisan, citizen-led redistricting enters the home stretch, we look back at our long history of attempting to craft a truly representative government. It’s been more complicated than you might think.
Our once-a-decade redistricting process is underway and the challenge to ensure that everyone across the state has fair representation is greater than ever. Today, people interested in the history of determining what representative government actually means in the United States often talk about the difference between reapportionment and redistricting, with reapportionment being how the number of seats is divided and redistricting being the drawing of the boundary lines. Colorado’s new Independent Redistricting Commissions and its additional seat in the United States House of Representatives are increasing the amount of attention being paid—throughout Colorado and around the nation—to how our electoral district lines are drawn this year.
The challenge of redrawing districts to enable people to perceive that they have some level of fair representation is not a new phenomenon. A look back at the history of redistricting in Colorado offers perspective on how previous generations have thought about representation, and what we can learn from them and apply to the current process.
Apportionment: Colorado’s Path to Eight Congressional Districts
How have Colorado’s electoral districts changed over time? Many people speculate that modern redistricting, with its precise details and powerful mapping software, is more difficult than ever. But controversy over redistricting is not anything new. We undertook this dive into past electoral district maps in Colorado to determine how the choices we are currently making are similar to and different from those in the past.
Colorado was admitted as a state in 1876. In a contested election, James Belford became the first member of the US House of Representatives from the State of Colorado, although Thomas Patterson, who succeeded him, had been a delegate from the Colorado Territory to the 44th Congress. Representation in the US House of Representatives is organized by population, with each state having at least one representative, no matter how many people live in the state.
Apportionment is the process by which the seats in the house are allocated. The methods for apportionment have changed over time, starting with Thomas Jefferson and Alexander Hamilton proposing competing mathematical formulas. Following the 1880 census, which counted 194,327 people in the state, Colorado was apportioned one of the 325 seats then in the House (thirty-three of which were added in that redistricting cycle), so no electoral district lines were drawn.
The 1890 census reported Colorado’s population at 413,249. This spectacular growth—enabled by the US government’s efforts to drive out Indigenous people and open the land to American settlement, and driven by mineral rushes, agriculture, and Colorado’s relative proximity to eastern markets—allowed the state to gain a second seat in the House, which now had 356 members (an increase of thirty-one seats). In its growth, Colorado in this decade mirrored other Western states. Throughout the region, the growing populations in new states were propelled by national policies and military power forcing Native American tribes into smaller and smaller territories (often in violation of existing treaties), continuing effects of the Homestead Act of 1862, and efforts of the railroad companies to encourage settlement with cheap land. Throughout the West, the steady stream of miners, ranchers, farmers, and town builders, increasingly traveling on an expanding web of railroad lines, were so diffused across the region that the 1890 census declared the “frontier”—that mythical idea of western lands with fewer than two people per square mile—no longer existed.
Having two representatives necessitated the division of the state into two districts. The text of the bill dividing the state was fairly brief, simply listing out which counties would constitute the first congressional district and which the second. The state was simply divided among counties, without the microtargeted districts we associate with redistricting and gerrymandering today.
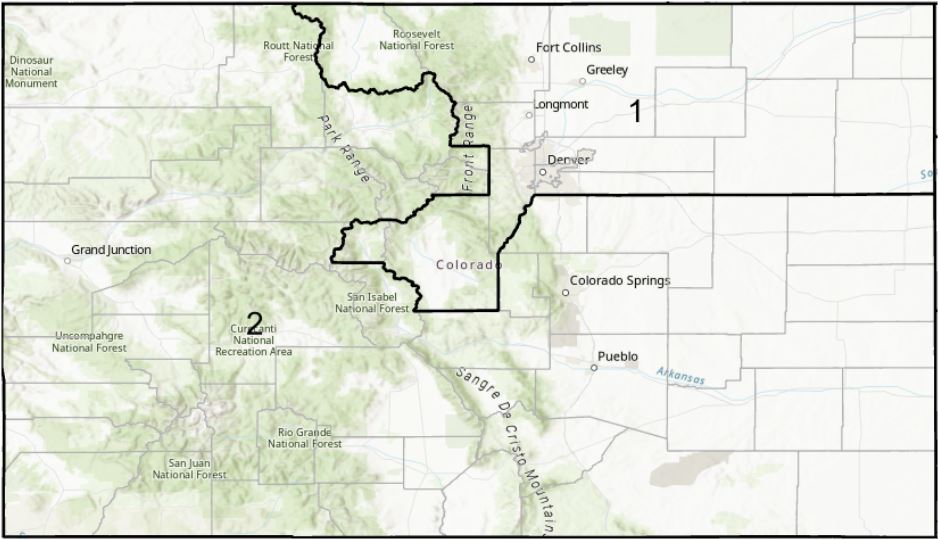
Colorado congressional districts, 53rd Congress, 1893
Though the text of that bill was straightforward, its path through the legislature was anything but. April 6 was the last day of the legislative session that year. House Bill No. 171, the redistricting bill, was referred out of its Colorado Senate committee on April 4, with amendments relocating Park and Lake Counties to the second congressional district and moving Clear Creek, Gilpin, Grand, Rio Blanco, and Routt Counties to the first. After that, in the remaining two days of the session, four conference committees considered the bill, with each of the first three dissolving without reaching agreement. Ultimately, the Senate adopted the bill as passed by the House, without the Senate amendments.
Colorado gained a third congressional seat in 1901 with a population of 539,700, an increase of 30 percent from 1890, compared to an increase of 21 percent for the United States as a whole. From 1903 until 1913, two members were elected from Districts 1 and 2, and one from an at-large district, which meant that the whole population was voting for one member in addition to individual members from smaller geographical districts (single-member districts). The US House of Representatives now had 386 members, with Illinois, New York, and Texas gaining three seats each and seven states west of the Mississippi River gaining one seat each. The relative shift in power represented by population increases in western states and migration from the northeast to the southwest has been evident for over a century.
The people who decide about apportionment and redistricting have always been cognizant of the geographic power of including or excluding certain groups of people in voting districts. Sometimes they packed people in one district to minimize their political power and at others distributed them throughout multiple districts to dilute their voices. Following the 1910 census, forty-nine seats were added to the US House, bringing the total number of members to its current count of 435.
In 1911, Colorado was granted a fourth congressional seat, a number that would not change until 1971. To fill the four seats, two members at-large were elected for the last time in 1913. That spring, the state’s General Assembly passed legislation dividing the state into four congressional districts. Notably, for the first time, the City and County of Denver was designated a district unto itself (the First District) and granted its own representative. The law went into effect the following year, and since the 1914 election all US House members from Colorado have been elected from single-member congressional districts.
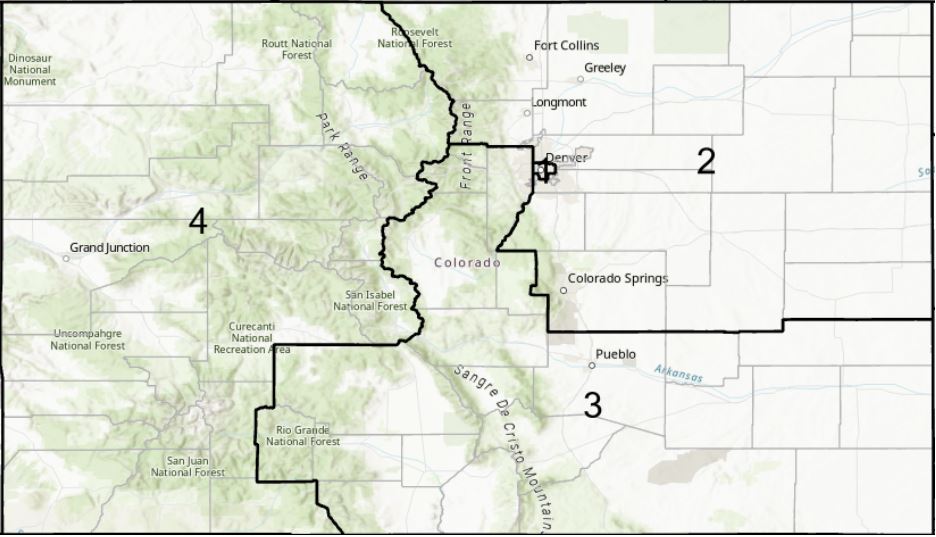
Colorado congressional districts, 66th Congress, 1919
The 1911 reapportionment was the last in which no states would lose representation, because the hard-fought 1929 Permanent Apportionment Act fixed the size of the House at 435 seats (save for a temporary increase to 437 members from 1959 to 1963 after Alaska and Hawaii achieved statehood). Thereafter, apportionment would be constrained, with growing states gaining representation at the expense of those whose populations were not keeping pace. As the population in the United States increased, urban and rural conflicts affected the governance process, resulting in disputes among the members of Congress about representation. During this time, the authors of The Historical Atlas of State Power in Congress, 1790–1990, Kenneth Martis and Gregory Elmes, describe “nonapportionment” following the 1920 census as centering one of two propositions: (1) expand the House once more to accommodate all states and ensure no losses of seats; or (2) fix the House size at 435 and reapportion accordingly.
The battle tied up Congress for most of the decade, with no side prevailing until 1929, when legislators finally agreed to set the cap for representatives in the US House at 435 and agreed to reapportion congressional seats going forward without requiring negotiation by members of Congress about the number of seats added or how those seats would be divided up mathematically.
The Census Bureau was faced with the task of implementing the reapportionment process created by the 1929 Permanent Apportionment Act. Following the 1940 census, the bureau’s solution was to develop the Method of Equal Proportions in 1941, which represents an attempt to minimize the relative differences in the number of people per representative among the states. Each state is apportioned its first representative, then the priority value of each state’s population, multipliers, and total seats are computed, and seat numbers are assigned to the states to divide the remaining 385 seats. The Census Bureau provides mathematical and video explanations on its website.
In 1921, while the debate heated up in Congress, Colorado redrew its congressional districts according to the directive spelled out in the US Constitution. Colorado’s legislators were primarily animated by the state’s growing rural-urban divide, as the 1920 census found that for the first time more than half the 106,021,537 people in the United States lived in urban areas (although in Colorado just one of the four congressional districts—the First, encompassing Denver—could be classified as urban). From 1921 through 1964, the geographic boundaries of Colorado’s congressional districts remained the same, reflecting the inclination of rural areas to retain as much power as possible, in spite of a population shift away from the state’s rural communities toward the urban corridor around Denver and along the Front Range.
After the US Supreme Court held in their 1964 Wesberry v. Sanders ruling that districts in the US House of Representatives must be equal in population in order to uphold the principle of “one person, one vote,” Colorado’s boundaries, as well as those of many other states, were redrawn. Nevertheless, it is difficult to create equal-population districts across states with very different populations. For instance, the total population of the United States in 1960 was 179,323,175; dividing the population by the 435 seats would mean 412,237 persons per representative. But the smallest state by population, Alaska, had 226,167 people for one representative while New York, the most populous state, had 16,782,304 people for an average of 409,324 individuals per representative, and California had one representative for each 413,611 people. The distribution will never be completely even because of how our country is organized geographically, but the court’s ruling requires that the distribution within a state must be as even as possible.
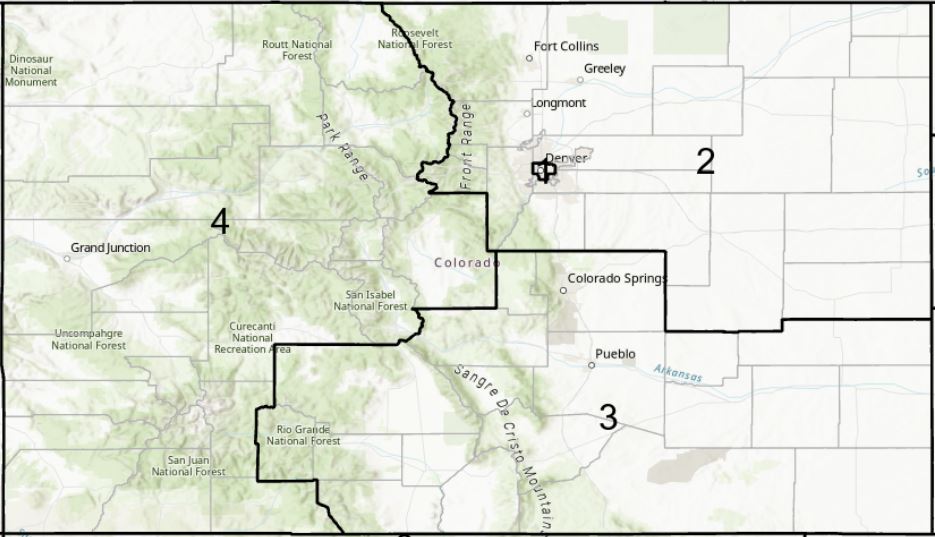
Colorado congressional districts, 68th Congress, 1921
Colorado did not gain another congressional seat until the 1970 census apportionment, which was also the decade that Colorado Springs surpassed Pueblo as the second largest city in the state. By 1980, when Colorado gained a sixth seat, almost 75 percent of the United States population was living in urban areas, but geographers Martis and Elmes found that California, Nevada, Arizona, Utah, and Colorado had greater than 80 percent urbanization. Consider that John Denver released “Rocky Mountain High” in 1972—at that point, only about 20 percent of Colorado’s population lived in the idyllic settings of wilderness, mountains, and open spaces he was singing about.
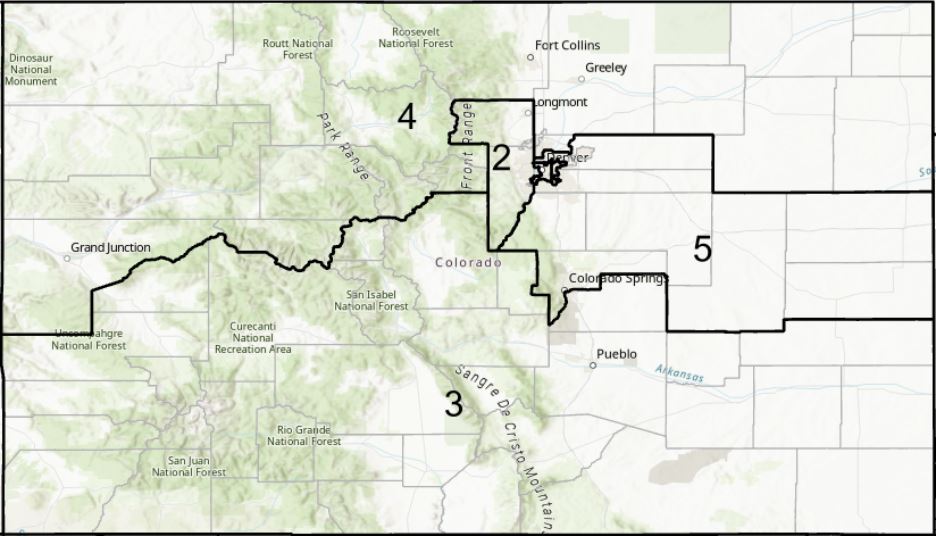
Colorado congressional districts, 93rd Congress, 1973
Colorado congressional districts, 98th Congress, 1983
Colorado congressional districts, 103rd Congress, 1993
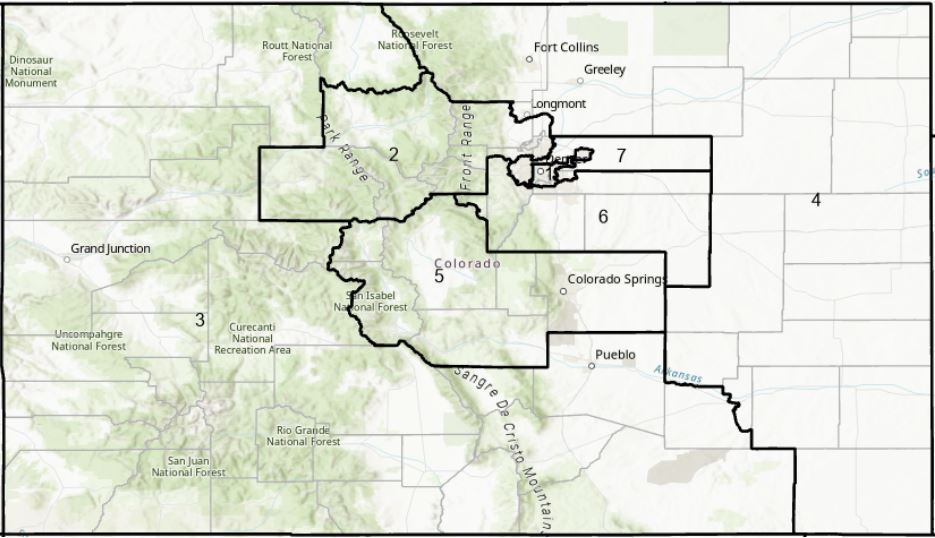
Following the 2000 census, Colorado added a seventh seat in the House of Representatives, with an eighth after the 2020 census. The national population shift seen early in the twentieth century continued, with people moving away from the Northeast and Midwest and concentrating in the South and West. As the American population increasingly tilts west and concentrates in urban areas, the region’s representation in Congress continues to grow. With the 2020 reapportionment, 43 percent of the seats in the US House of Representatives were in states west of the Mississippi, more than double what it had been in 1880, when 20 percent of the seats were in states west of the Mississippi.
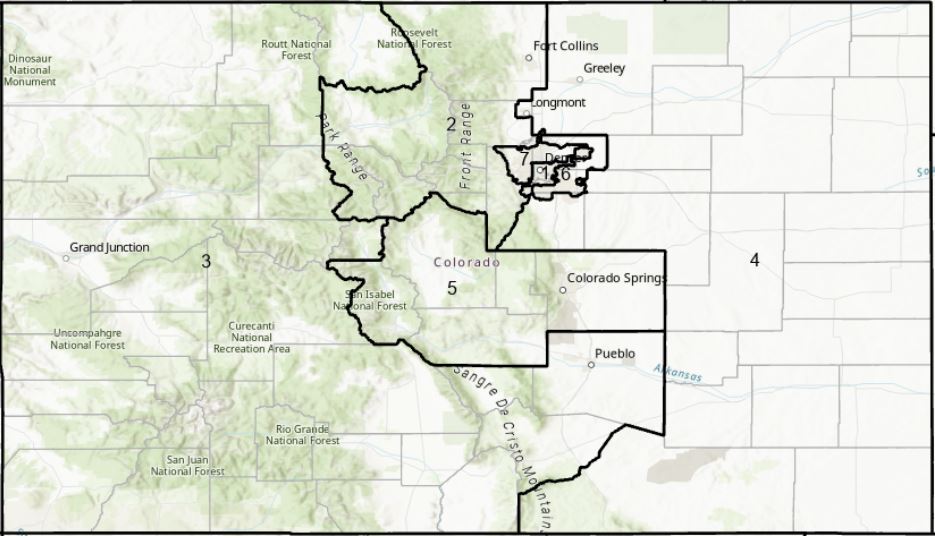
In Colorado, the trend within the state has also continued, with communities on the Eastern Plains and Western Slope—with some exceptions for resort communities—continuing to decrease in population as Coloradans concentrate along the urbanized Front Range corridor from Pueblo to Fort Collins and in a few mountain communities. The 2020 census found 84 percent of people living in urbanized areas along the Front Range.
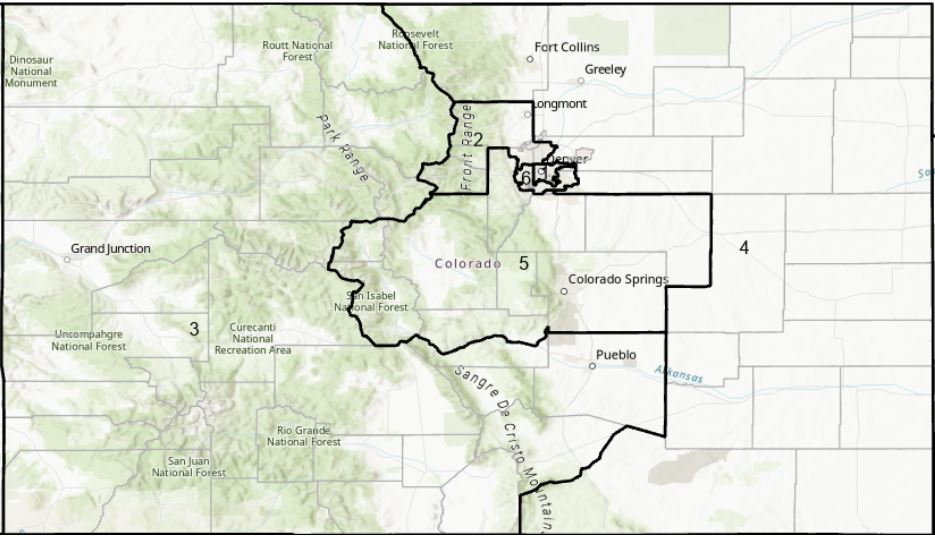
Colorado congressional districts, 108th Congress, 2003
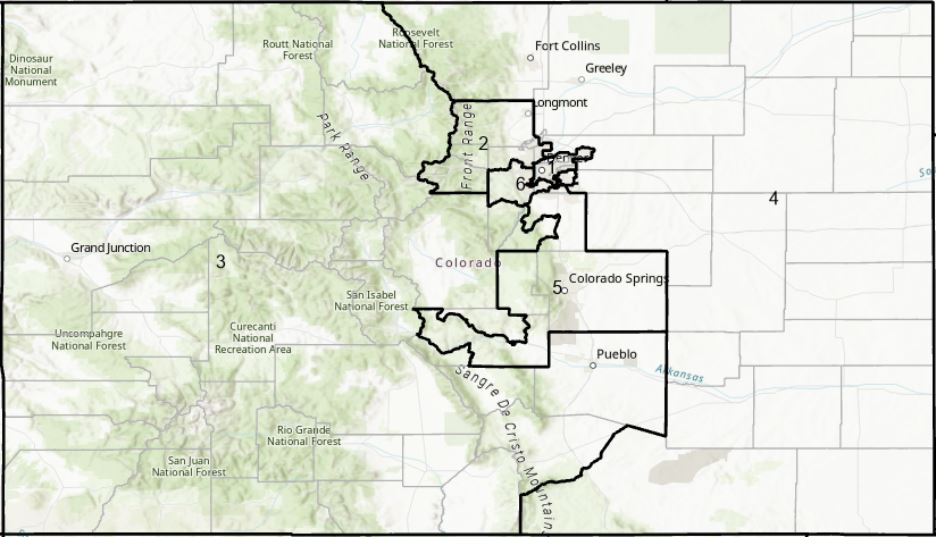
Colorado congressional districts, 113th Congress, 2013
The century-long migration, first noted in the 1920 census, of Americans concentrating in urban areas and leaving rural communities shows no sign of abating, and the issues it raises for congressional apportionment remain unsettled. Representative Ira G. Hersey of Maine framed the debate a century ago in terms that sound familiar today, raising an alarm that growing cities would seize greater representation in Congress at the expense of rural areas that produce the food and resources the nation relies on, which would make the House something less than truly representative of the nation: “One of the greatest dangers that confront the republic to-day is the tendency of the large cities to control the American Congress under the plausible plea that the consumer should control the Congress and that the producer should have no voice in the proceedings. Every ten years the attempt is made to change the House from a representative body to a small number who have removed themselves far away from a people that they do not attempt to represent.”
History of Legislative Redistricting
To what extent does Colorado’s state legislative redistricting mirror its congressional redistricting history? The Colorado House of Representatives and Colorado Senate are also now elected by geographic districts. Initial provisions of the Colorado Constitution included opportunities for reapportionment every five years instead of every ten, to account for the expected rapid growth in population. As Eleanore Bushnell noted in her 1970 analysis, Impact of Reapportionment on the Thirteen Western States, self-governance in counties “loomed large in the minds of the framers of Colorado’s Constitution.” The State House has had sixty-five members and the State Senate thirty-five since at least 1901, save for a brief period after the passage of a constitutional amendment in 1962. Legislative and congressional redistricting is completed through separate legislation. Prior to the 1960s, legislative districts were redrawn in 1901, 1913, and 1933. As the state added new counties, minor adjustments were made to the legislative districts in between, including an additional bill in 1909 to account for the separation of Denver from Arapahoe County.
As with the 1891 congressional redistricting, the 1913 legislative redistricting bill also passed on sine die, the last day of the legislative session. In 1932, an initiative passed redrawing legislative districts, but a bill in 1933 repealed that measure and allowed the legislature to adopt its own redistricting. The urban growth of cities in Colorado described in the 1930 census did not translate into proportional representation in the State House.
To create legislative districts, these early bills set ratios. For example, the 1933 bill assigned one state senator for the first 17,000 people and one representative for the first 8,000 people in a county, grouping smaller counties into a district to reach these numbers. Larger counties were considered their own districts and given additional senators and representatives depending on population. Denver was apportioned seven state senators in 1933, while the counties of Elbert, Lincoln, Kit Carson, and Cheyenne shared one. Pueblo had four state representatives under this scheme, and the counties of Eagle and Pitkin had one. The districts with multiple state senators or representatives then elected them at-large, meaning a voter in Denver would be voting for all seven state senators on the same ballot.
In considering the construction of these early state legislative districts—assigning seats to counties or groups of counties—it makes sense that during this time the process was commonly referred to as apportionment or reapportionment. Similar to congressional districts, the 1933 legislative apportionment remained in place until the 1960s. In 1956, Governor Ed Johnson called a special session to include reapportionment. The legislature considered apportionment measures in the special session but failed to adopt one. Initiative #4 in 1956 also addressed apportionment, but only 31 percent of the voters supported it. So, the 1933 districts stayed. As Eleanore Bushnell noted in her 1970 analysis, Impact of Reapportionment on the Thirteen Western States, “By 1957, it had become clear that some new apportionment would have to be adopted in 1960. Population was growing and shifting rapidly; but due to imbalance of growth, the representation ratios fixed in 1953 could not be applied to the new situation. The minimum population for each senator or representative would have to be revised upward or there would have to be more seats in both houses. The problem was further complicated by the fact that small districts were actually continuing to lose population.”
By the 1960s, people were beginning to recognize that continuing to hold new elections in old districts affected their representation. Colorado was only one of a number of states that had not made changes to electoral districts in decades. Eventually, the US Supreme Court intervened, issuing several opinions that ultimately set the standard of “one person, one vote” in congressional and legislative redistricting. Baker v. Carr, in 1962, found that redistricting is justiciable, meaning federal courts could hear redistricting cases. In Wesberry v. Sanders (1964), the court held that US congressional districts must have equal population. In Reynolds v. Sims (1964), they applied an equal population standard to state legislative districts as well.
On the same day it announced its opinion in Reynolds v. Sims, the Supreme Court also decided a case specific to Colorado, Lucas v. Colorado General Assembly (1964). The court decided several state legislative redistricting cases that day, but Lucas was unique in that the apportionment plan had been enacted through an initiative. The holding in Lucas invalidated Amendment #7, which Colorado voters had adopted in 1962.
Amendment #7 set a requirement for substantially equal population among State House districts, and for the State Senate it instructed that when a county gets more than one senate seat, the county should be divided into districts of substantially equal population. The measure also expanded the size of the State Senate from thirty-five to thirty-nine and assigned the additional senators to specific counties. The voters in 1962 also considered and defeated an alternative, Amendment #8, which would have more evenly apportioned legislators in both houses but maintained the system of electing all legislators from a single county at large, unless the county voted to move to districts. Amendment #8 would also have created a three-person commission to periodically reapportion the legislature.
What will the congressional and legislative maps look like for the elections in 2022? Anyone with access to a computer can explore online mapping software to make their opinions known. The official website of the Colorado Independent Redistricting Commissions includes an Online Redistricting Portal in which one can view and draw maps. Public-written comments and proposed maps may be uploaded. Open-source platforms—Districtr or Dave’s Redistricting App—offer additional avenues for participation. Upcoming public hearings and previous meetings can be attended virtually or in person. People from past decades have been concerned about how they and their communities are being represented at the federal, state, and local levels.
After the Supreme Court found Amendment #7 to be unconstitutional, the voters in 1966 adopted Amendment #4, requiring single-member districts for both chambers of the legislature and returning the State Senate to thirty-five senators. The measure left it to the legislature to draw the districts, requiring them to do so by 1967 and after each decennial census thereafter. Bushnell found gerrymandering did take place in Colorado, exemplified by population extremes and oddly-drawn districts, one with fifteen jutting peninsulas and ninety-six sides. Today, drawing districts for partisan advantage can take place with much less obvious manipulation, thanks to geospatial mapping technology.
In 1972, the League of Women Voters mounted an effort to have redistricting completed by a commission and proposed a Colorado State Reapportionment Commission Amendment, primarily composed of political appointees. The commission amendment was approved on November 4, 1974. No more than six members could be from one political party. No legislative committees are explicitly responsible for congressional redistricting and bills on the subject are assigned to committee after they are proposed. The governor has veto power only over the congressional plan. As with many legal documents, there was dispute over interpretation. The Legislative Drafting Office offered comments to the Commission in September of 1981 on elements of equal population, contiguity, preservation of municipal and county boundaries, and communities of interest, which Lyle Kyle, longtime director of Colorado Legislative Council Staff, determined to be a reasonable effort to achieve fair representation rather than assuring any group a particular representative.
There were a variety of legal challenges to the plan from residents across the state ranging from lack of publication of proposed maps to splitting of counties, but the Colorado Supreme Court generally found that the Commission had acted within its constitutional bounds and focused on the importance of having, as Kyle noted, an “identifiable senatorial representative.” The concerns presented in this review are echoed in what is being discussed today across Colorado during public hearings and submitted as part of public comments—seemingly arbitrary splitting and combining of political subdivisions, discussions about what constitutes a community of interest and how that community should best be represented, and procedural issues such as time constraints.
With a state relatively evenly divided between Republicans and Democrats over the past several decades, partisan drawing of districts continued to be a concern of fair government advocates in Colorado. Although several rounds of redistricting included public meetings, legal challenges to enacted districts also were a recurring factor. Gerrymandering was seen by some as an inevitable part of the legislative landscape. Bob Loevy, who served on the Colorado Reapportionment Commission in 2011, observed that “Political parties have no choice but to work hard at gerrymandering legislative seats in their favor. If they do not, the opposition party will gerrymander them, and the first political party will lose ground in its efforts to elect majorities in both houses of the state legislature.”
In 2018, two competing groups came together to create “Fair Maps Colorado,” proposing Amendments Y for congressional districts and Z for state legislative districts. The measures were passed, and as a result Colorado’s current redistricting process is being led by the 2021 Colorado Independent Redistricting Commissions. With more direct involvement from non-politicians, both as members of the commissions and as contributors to the discussion through public comments and proposed maps, Colorado has a chance to try another approach to legislative map drawing.
Having citizen involvement does not eliminate politicians’ needs or desires from the conversation. Elected officials still want their voices heard in the process, and state legislators, county officials, and city council members have joined other citizens in sharing their viewpoints through the public hearing process. However, they are now no longer the only voices at the table, and community members and their maps have been elevated to a more prominent position. Whether a fair map is drawn is really up to the Commissioners. They are empowered to interpret the criteria described in the amendments, and to make the decision about who to group where, but there is nothing in the legislation to determine whether they make different decisions than the elected officials.
It may take two or three redistricting cycles—two or three decades—before we are able to assess how effective the Independent Redistricting Commissions are in promoting fair, nonpartisan maps. Future historians of redistricting in the state will ultimately write the next chapter in Colorado’s effort to design a truly representative government, but today’s Coloradans are writing the first draft right now.
For further reading
Explore government websites to read about historical changes in the US House of Representatives and the US Census Bureau. Compare Colorado’s redistricting process with those of other states in the region in Eleanore Bushnell’s review, Impact of Reapportionment on the Thirteen Western States. The Congressional Record offers a variety of perspectives on issues of the day, as can be found in Representative Ira Hersey’s remarks during the 1921 Apportionment Debate on January 18. If you are looking for details about nuts and bolts of the process, Lyle C. Kyle prepared a review of the redistricting process for the Colorado Legislative Council in 1982, entitled Reapportionment of the Colorado General Assembly 1972–1982. More recently, Robert D. Loevy’s Confessions of a Reapportionment Commissioner–2011 brings personal perspective to the previous effort to draw lines in Colorado following the 2010 census. For additional historical and geographic context, examine The Historical Atlas of State Power in Congress, 1790–1990 by Kenneth C. Martis and Gregory A. Elmes. The US Census Bureau explains the method of equal proportions here and provides a video.
Maps
The United States Congressional District Shapefiles website provided the information for the historical congressional district lines. (Jeffrey B. Lewis, Brandon DeVine, Lincoln Pitcher, and Kenneth C. Martis, 2013. Digital Boundary Definitions of United States Congressional Districts, 1789–2012. Data file and code book. Retrieved from https://cdmaps.polisci.ucla.edu on 1 June 2021.) Maps were created in ArcGIS Pro through the University of Colorado Colorado Springs.
Authors’ note: Apportionment information from the US Census Bureau delivered in April 2021 confirmed what political observers had long expected: Colorado gained a new seat in the US House of Representatives, increasing the state’s total to eight. Rebecca Theobald and Julia Jackson combed through records at the Colorado State Capitol, historical maps and atlases, and previous analyses of apportionment to explore how congressional and legislative district lines have changed and evolved since the state’s earliest days. As a geographer, Rebecca Theobald has been concerned about the outside importance that geospatial technology tools now play in the electoral redistricting process, particularly in light of the fact that most individuals are not familiar with geographic information systems (GIS) beyond accessing a route or searching for the nearest service on a cell phone. GIS platforms often include a huge amount of information that can be analyzed and deployed for businesses, public services, and, unfortunately, nefarious objectives. In the case of legislative representation, partisan manipulation of electoral districts has in some places become an art form. In her work with the Independent Redistricting Commissions, Julia Jackson found that gerrymandering took place long before online mapping became the preferred method to create electoral boundaries. When we were initially contacted about writing this piece, we were sure that someone somewhere had already analyzed Colorado redistricting, and that we would be able to consult with them on the process, learning about previous choices made by the legislators charged with drawing maps, placing today’s process (with which we are more familiar) into perspective. It turns out that comprehensive history has yet to be written, although connections between the geography and economic diversity of the state and the ensuing challenges to facilitate equal representation for all people in Colorado have been described in other forums. We hope that this review provides inspiration for additional analysis and understanding.
More from The Colorado Magazine
A Big, Complex, and Incomplete Story of the Vote In the fall of 2018, I started working on plans to commemorate the 100th anniversary of the 19th Amendment. As we mark this occasion on August 26, what I thought would feel like an ending to this work feels like just the beginning.
1904: The Most Corrupt Election in Colorado History Between stuffed ballot boxes, election clerks hopping off trains, and three governors in a day, Devin Flores might just have a point.
Nine Justices and One Colorado Lawyer The Landmark Romer v. Evans Gay Rights Case