
Democrats now outnumber independents in N.J., not in 2nd
{child_byline}MICHELLE BRUNETTI POST
Staff Writer
{/child_byline}
Democrats surpassed unaffiliated voters this year as the largest voting bloc in New Jersey, according to an analysis released Tuesday by the William J. Hughes Center for Public Policy at Stockton University.
The trend toward more Democratic voters is happening in South Jersey, but is less dramatic, with Cape May County still a Republican stronghold and independents still the largest blocs in the 2nd and 3rd congressional districts.
Still, Democrats are gaining in those areas faster than the GOP, said Hughes Center Executive Director John Froonjian.
The trend is expected to continue as voter registration drives in preparation for the Nov. 3 Presidential Election begin in earnest after Labor Day, he said.
People are also reading…
Democrats in the 2nd Congressional District outperformed Republicans in both registering voters and in turning them out for the July 7 primary, Froonjian said.
Some gains came from previously unaffiliated voters declaring parties.
He credited two main factors for the Democratic surge in both registration and turnout: a highly motivated Democratic base, and the emphasis and ease of voting by mail.
Atlantic County Democratic Chairperson Michael Suleiman said registration and turnout are being driven by enthusiasm for national politics.
“But I want to caution people ... while there is certainly a lot of anti-Trump sentiment fueling (presumptive Democratic candidate for president Joe) Biden’s success, we as Democrats need to double down and not make the same mistake we made in 2016,” Suleiman said. “We have to not just make the anti-Trump case, but the pro-Biden/(Kamala)Harris case.”
Atlantic County GOP Chairman Keith Davis had a different take on the numbers.
“In the primary, eight South Jersey Democratic Chairs demanded that all candidates for Congress pledge to not work with the Craig Callaway organization,” Davis said of the former Atlantic City councilman and Democratic power broker who has been accused of improper handling of ballots. “With the Callaways hard at work in the Democratic Party, it should come as no surprise that there has been an increase in Democratic voter registration numbers.”
Cape May County now has 30,203 registered voters in the GOP, 18,240 as Democrats, and 23,638 unaffiliated. The number of unaffiliated voters is down from 25,641 in 2018.
Democrats and Republicans each gained about 2,000 voters in the county since 2018, some coming from unaffiliated and some from new registrations, Froonjian said.
Independents still many in 2nd District
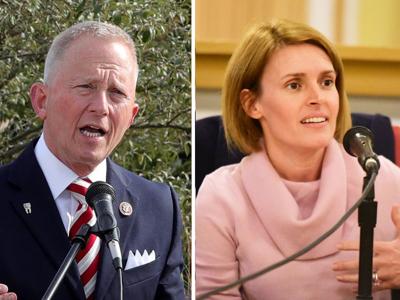
In the 2nd Congressional District covering much of South Jersey, where Democrat Amy Kennedy is challenging Rep. Jeff Van Drew, R-2nd, after his party switch last year, independents still make up the largest bloc at 37% of the electorate. But their numbers declined by 11,000 in the past year, Froonjian said, mostly benefiting Democrats.
There are about 15,000 new Democrats and 11,000 new Republicans district-wide in the last year, he said.
“Between new registrations (16,000) and independents joining parties (11,000), both are gaining, but Democrats are gaining more,” Froonjian said of the district. “And consider that the 2nd District has always been considered a Republican-leaning district.”
A surge in Democratic Party registration also drove record-breaking vote totals in the July 7 primary elections and resulted in more Democratic than Republican votes being cast in every congressional district primary in the state, Froonjian said.
In the 2nd District, according to final election results, about 70,000 Democrats cast votes as did about 55,000 Republicans. It was more than a doubling of 2018 participation by Democrats, and almost a doubling by Republicans.
The increase in Democratic numbers made sense there, because the Democratic primary was a much more contested race, with five candidates.
Kennedy won with 43,414 votes to Brigid Callahan Harrison’s 15,560 and Will Cunningham’s 8,946. Two others had about 1,000 votes each.
But the numbers seemed to make less sense in the 3rd Congressional District, where Democratic incumbent Andy Kim ran unopposed yet received 79,000 votes — 20,000 more than the total cast in the hotly contested Republican primary between Kate Gibbs and winner David Richter, according to the Hughes Center analysis.
The 3rd covers most of Burlington County and southern Ocean County.
Richter had first announced he would run in the 2nd District, but was pressured to withdraw from that race after Van Drew switched to the Republican Party after voting against impeachment of President Donald J. Trump.
Even in the Republican stronghold of the 4th District, where the Congressional seat has long been held by Republican Rep. Chris Smith, more Democrats came out for the primary, Froonjian said.
Total Democratic votes for president were higher than in 2016, Froonjian said, when Bernie Sanders still competed for convention delegates against Hillary Clinton.
President Donald Trump, running unopposed in the Republican primary, received 404,000 votes this year, less than in 2016 when he received 448,000, Froonjian said.
“Primary participation overall was high, but we saw consistent increases in Democratic numbers over 2018, even when incumbents were unopposed. And 2018 was considered a Democratic year,” Froonjian said. “Voting in the recent congressional races was also higher than in 2016, another presidential primary year.”
In the 1st District, covering most of Camden County and parts of Burlington and Gloucester counties, incumbent Democrat Donald Norcross ran unopposed, Froonjian said. He still got about 94,000 votes — more than double the total Democratic votes cast in 2018, when Norcross had two primary opponents.
“In the 1st and other districts, Democrats are unopposed yet they get more votes than when they had a primary challenge,” Froonjian said, calling the situation “almost shocking.”
{child_tagline}
{/child_tagline}
{child_related_content}{child_related_content_item}{child_related_content_style}Just The Facts{/child_related_content_style}{child_related_content_title}Voter registration statistics{/child_related_content_title}{child_related_content_content}
U D R
NJ
8/20 2.3 million 2.44 million 1.39 million
8/19 2.36 million 2.29 million 1.32 million
% change -3% +7% +5%
CD2
8/20 189,572 171,016 150,377
8/19 200,605 156,515 139,463
% change -5% +9% +8%
CD3
8/20 202,364 179,185 162,906
8/19 212,561 162,671 152,159
% change -5% +10% +7%
{&bullet}U=unaffiliated D=Democrats R=Republicans O=Other
SOURCE: Hughes Center for Public Policy at Stockton University
{/child_related_content_content}{/child_related_content_item}{/child_related_content}