
How Much Does Inflation Vary by Income? Depends on How It’s Measured

Introduction
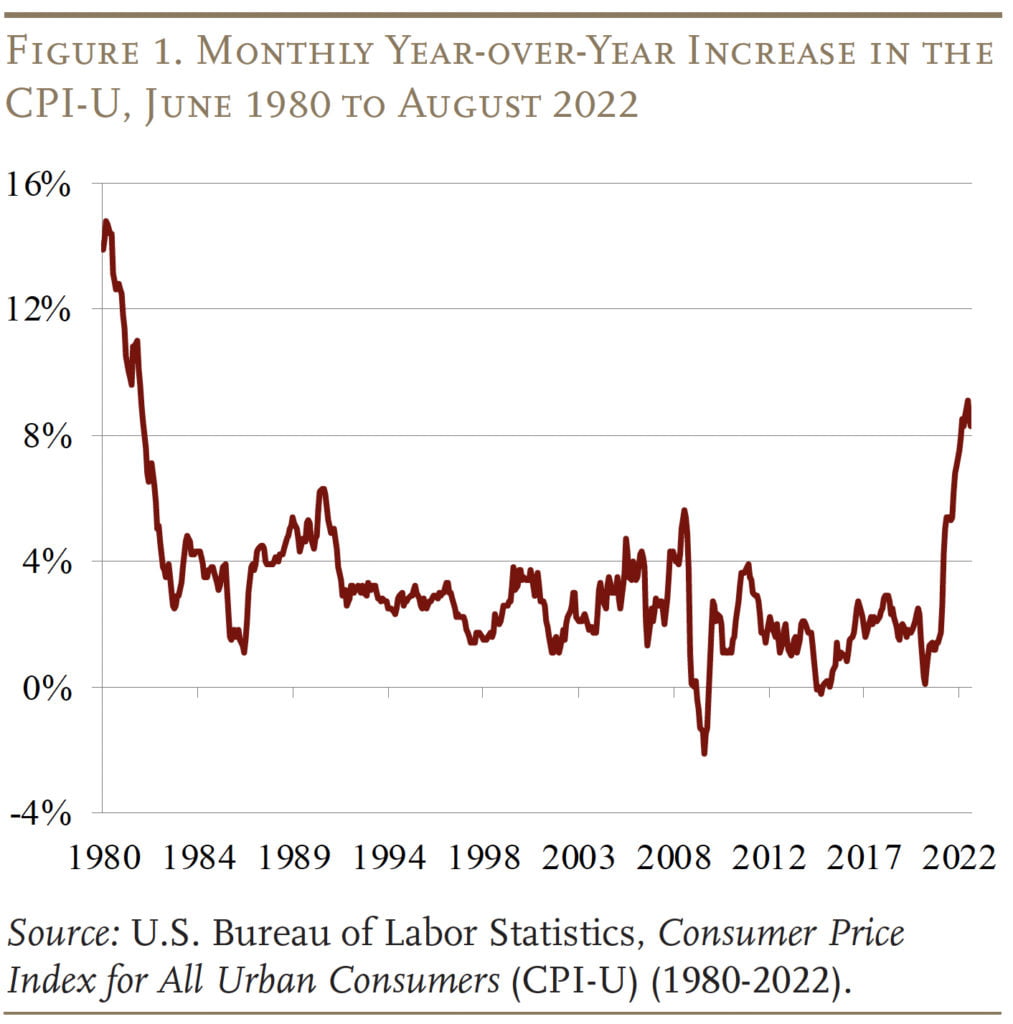
In June, the U.S. Bureau of Labor Statistics (BLS) announced the largest 12-month increase in the Consumer Price Index for All Urban Consumers (CPI-U) since 1981 – a rate of 9.1 percent. The rise in inflation was driven primarily by higher prices for gasoline, housing, and food. Although inflation has moderated somewhat, it still remains very high. The question is the extent to which the effects of inflation vary for households with different income levels.
This brief addresses the distributional question with a straightforward analysis that weights the eight major categories in the CPI-U by expenditure data from BLS’s Consumer Expenditure Survey (CEX) for each income quintile. The confounding issue, however, is that low-income households spend virtually all their after-income-tax money on inflation-affected items, while high-income households spend only 80 percent of their resources on these items.
The discussion proceeds as follows. The first section summarizes recent research on inflation by household income. The second section describes the CPI-U and expenditure data from the CEX. The third section discusses the methodology. The fourth section presents the results, which show that inflation rates for the 12-month period ending in June 2022 for items included in the CPI-U are roughly similar across income groups. The final section concludes that, despite facing similar inflation levels, low-income households spend virtually all of their income on affected items, exposing a larger share of their resources to price increases compared to high-income households.
Background
Inflation in the United States has been relatively low for four decades, with the recent surge producing rates not seen since the early 1980s (See Figure 1). Hence, very little research has been done to determine the relative impact of rising prices on households at different income levels.
One exception was a 2006 study that looked at inflation experiences based on spending patterns for 31 different groups and for the urban population as a whole. The researchers concluded that inflation is essentially an aggregate shock and that the CPI-U does a good job measuring inflation for a host of different demographic groups.1McGranahan and Paulson (2006).
A more recent analysis explored the impact of inflation in 2021 using expenditure patterns in both 2019 and 2020.2He and Sun (2021). The analysis showed that while lower-income households appear to spend more of their budgets on goods and services that were more impacted by inflation, the difference in experienced inflation is relatively small – 6.8 percent for households in the lowest quintile and 6.3-6.4 percent for those in the highest quintile.
The most comprehensive analysis is a recent working paper by BLS researchers. They examined the period from December 2003 to December 2018, during which annual inflation averaged 2.1 percent. They found that annual inflation for low-income households was slightly larger than for high-income households, at 2.2 percent compared to 2.0 percent.3Klick and Stockburger (2021). This difference was due to larger expenditures as a share of spending on items that experienced faster price increases, such as rent and electricity. As discussed below, this study will serve as a basis for testing the substantially cruder methodology used in this analysis.
Data
Determining inflation patterns by household income requires inflation rates for various goods and services and data on household spending for those goods and services. For this analysis, the price data come from the CPI-U and the expenditure data from the CEX.
CPI-U
The CPI-U is the most commonly used measure of inflation and estimates average price changes faced by urban consumers for a market basket of goods and services. It covers about 93 percent of the population and is composed of 8 major indices, representing various consumption expenditures (see Table 1). CPI-U indices are determined by the change in prices of the underlying items and by the share of consumer spending on those items.
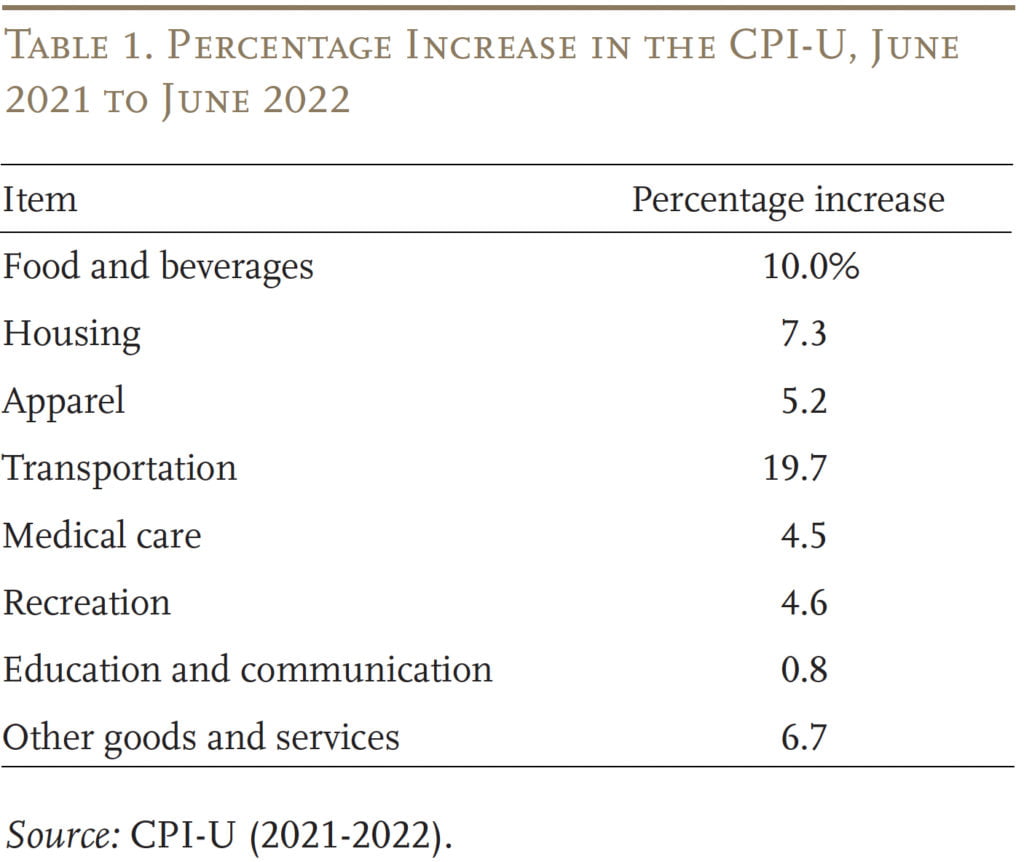
In June, the indices with the largest 12-month price increases were transportation, food and beverages, and housing – with inflation rates of about 20, 10, and 7 percent, respectively. In contrast, education and communication experienced the lowest rate of inflation at about 1 percent, driven in part by a decrease in prices of smartphones.
CEX
Since expenditure data for 2021 are not yet available, the analysis uses expenditure data from the 2020 CEX. The CEX includes self-reported information on semi-annual and annual U.S. after-income-tax consumer expenditures by household income and demographic characteristics for the U.S. civilian noninstitutional population. CEX data are integrated from two surveys: 1) the Interview Survey, for large expenses such as property and rent, and 2) the Diary Survey, for smaller and frequently purchased items, such as food and beverages.
CEX data are routinely used to weight the relative importance of goods and services and adjust market baskets that make up CPI indices. While the majority of consumer expenses are covered by the two surveys, spending by family members on vacations or away-from-home overnight is not accounted for. Interestingly, the CEX expenditure categories include contributions to Social Security and retirement plans, as well as outlays for life insurance and personal cash contributions. These items, which are described below as “savings for retirement,” are not included in any of the CPI categories.
In the case of those CEX expenditures that do coincide with items included in the CPI-U, most fall naturally into the CPI categories. Only about 3 percent needed to be rearranged. Specifically, the sub-categories of telephone services and postage are included under housing in the original CEX, but are added into education and communication for this analysis. And spending on apparel services, personal care products and services, and tobacco products (as well as miscellaneous items) is grouped into “other goods and services.”
Figure 2 shows the share of household expenditures in 2020 by income quintile for each CPI category. In 2020, the lowest quintile had an average after-tax income of $15,140, the middle group had 58,001, and the highest-income quintile had $176,094. All groups spent the largest proportion of their income on housing, with low-income and high-income households spending 40 percent and 30 percent, respectively. The biggest difference in expenditures by household income is in savings for retirement.
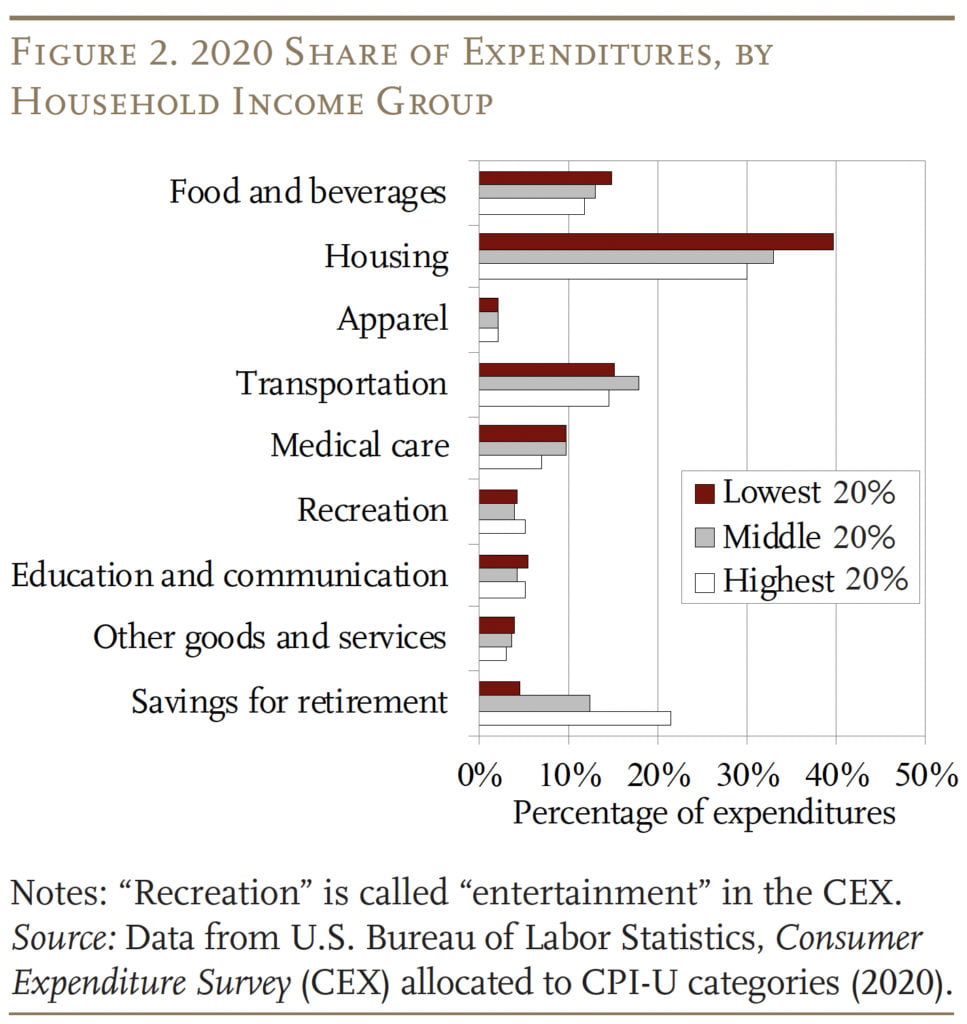
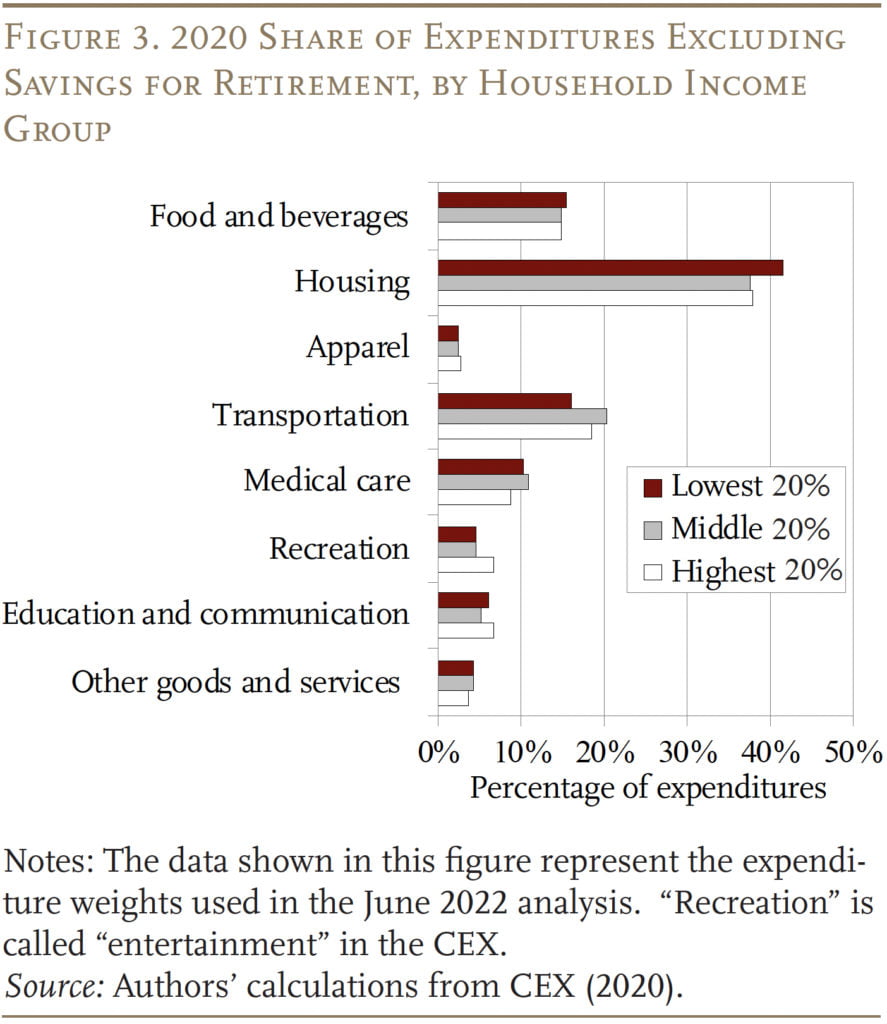
Because spending under savings for retirement is not represented in the CPI-U, the analysis excludes this category both from the calculation of expenditure weights used to compute inflation by income quintile and from total expenditures. The result is that the share of spending across low-, middle- and high-income households is quite similar within categories (see Figure 3).
Methodology
The methodology involves simply weighting the 12-month inflation rate from June 2021 to June 2022 reported for each of the eight categories in the CPI-U by the percentage of the CEX 2020 budget spent on those categories for households in each income quintile.
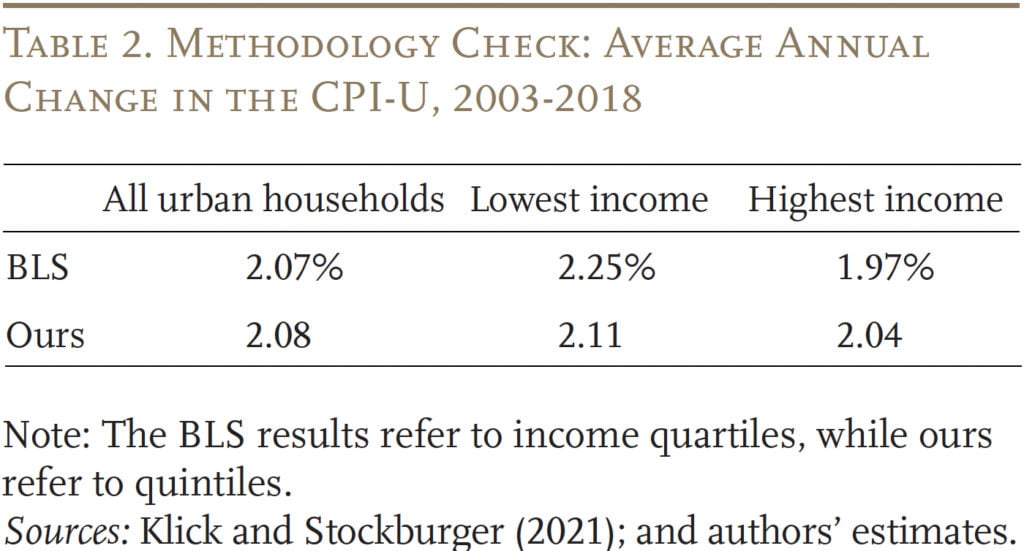
In order to validate this simple approach, we attempted to replicate the 2003-2018 BLS estimates for inflation by household income. Due to data availability, the two approaches differed in a number of ways. First, while the BLS uses monthly changes in the CPI, we take the average annualized change from the base period of December 2003 to December 2018. Second, each monthly index in the BLS estimates is weighted by biennial expenditure shares two years prior and updated in January of even years. For example, the index for December 2003 is weighted by average annual spending as a share of income over 2001 and 2002. In contrast, our analysis weights the annualized 2003-2018 CPI-U by average annual spending shares from pooled 2003 and 2018 CEX data. Third, income groups in the BLS are presented as quartiles, rather than the income quintiles depicted in this analysis.
Despite these numerous differences, the results are similar (see Table 2). Both approaches produce almost the same average annual rate of inflation over the 2003-2018 period, and both show that low-income households experienced slightly higher annual inflation rates than high-income households over the period.
Comforted by the methodology check, the following reports the results of weighting the 12-month June 2022 inflation rate for each of the eight major categories by the annual share of spending in 2020 on that category for households in each income quintile.
Results
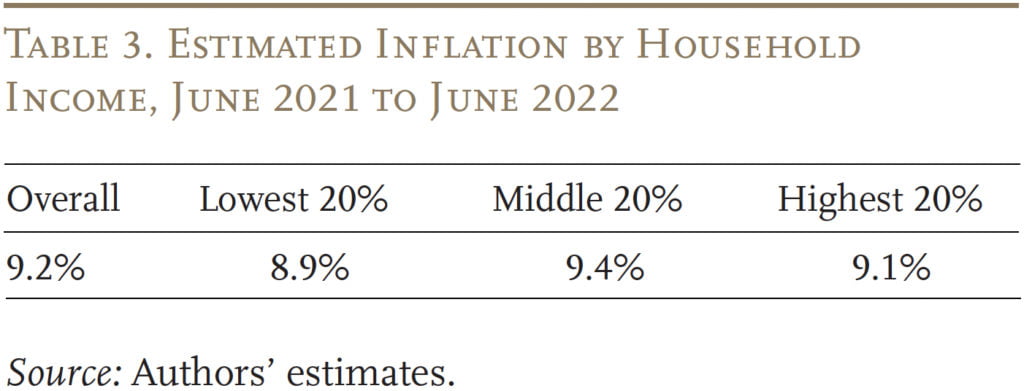
Table 3 shows that the estimated 12-month inflation rate in June 2022 experienced by different income groups was roughly similar, with middle-income households experiencing the highest inflation rate at 9.4 percent, and low- and high-income households experiencing inflation rates of 8.9 and 9.1 percent, respectively. This finding should not be surprising given that, as shown above, the share of outlays by category does not vary noticeably by income.
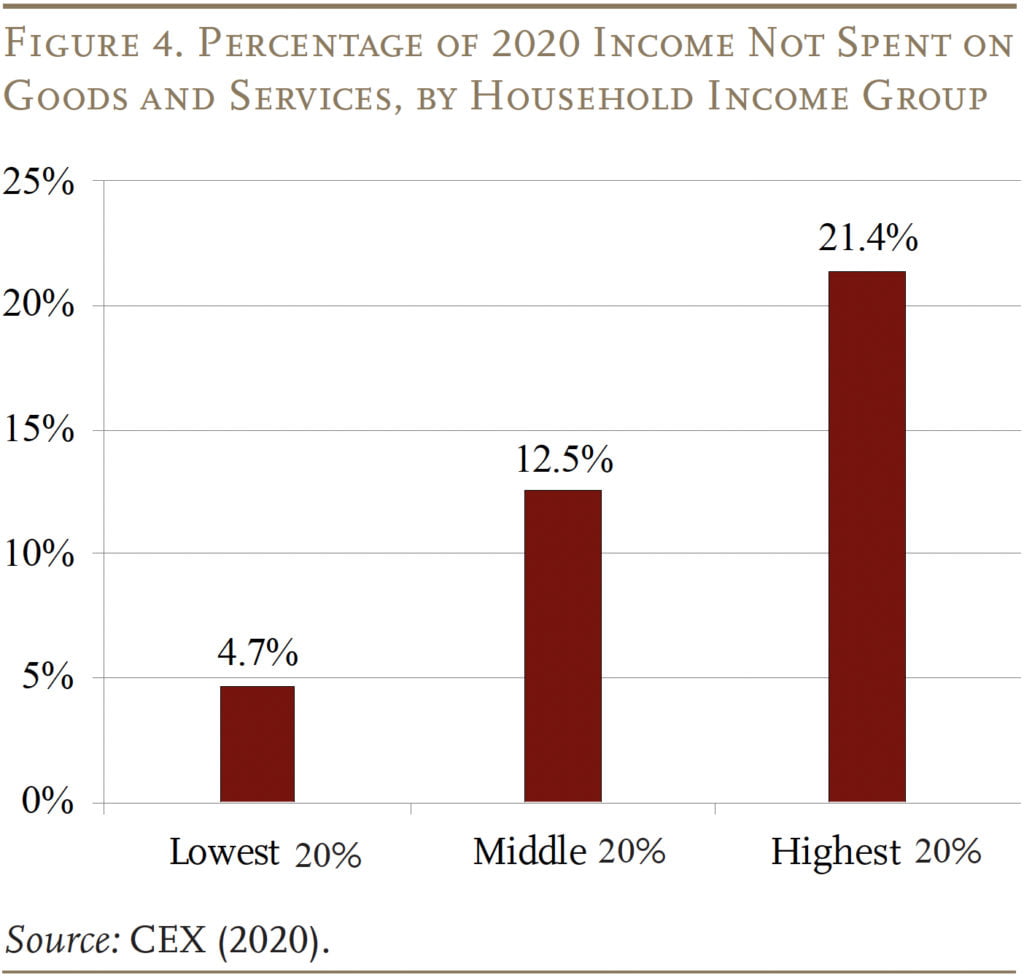
The conundrum that remains, however, is that a substantial share of the after-income-tax resources of high-income households goes to savings for retirement – a component not affected by rising prices (see Figure 4). In contrast, low-income households spend almost all of their income on inflation-affected items. Therefore, one could argue that at least on the expenditure side, the wealthy are much less affected than the low-income by current high inflation. Of course, in a lifecycle sense, savings are exposed to inflation eventually when they are spent. But savers have time to shift their consumption patterns in preparation for these eventual impacts, an advantage unavailable to those forced to spend today.
Conclusion
Low-income and high-income households faced roughly similar inflation rates in June 2022. However, the rich are able to afford saving for retirement and investing in insurance against adverse events. As a result, the proportion of their after-income-tax resources spent on items included in the CPI-U is significantly lower than that of the poor. Yes, prices will be higher when the rich spend their savings, but they have years to rearrange their spending patterns.
References
He, Zheli and Xiaoyue Sun. 2021. “Impact of Inflation by Household Income.” University of Pennsylvania Budget Model. Philadelphia, PA.
Klick, Josh and Anya Stockburger. 2021. “Experimental CPI for Lower and Higher Income Households.” Economic Working Paper WP-537. Washington, DC: U.S. Bureau of Labor Statistics.
McGranahan, Leslie and Anna Paulson. 2006. “Constructing the Chicago Fed Income Based Economic Index – Consumer Price Index: Inflation Experiences by Demographic Group: 1983-2005.” Working Paper WP 2005-20. Chicago, IL: Federal Reserve Bank of Chicago.
U.S. Bureau of Labor Statistics. Consumer Expenditure Survey, 2003, 2018, 2020. Washington, DC.
U.S. Bureau of Labor Statistics. Consumer Price Index for All Urban Consumers, 1980-2022. Washington, DC.
Endnotes
- 1McGranahan and Paulson (2006).
- 2He and Sun (2021).
- 3Klick and Stockburger (2021).


Munnell, Alicia H. and Diana Horvath. 2022. "How Much Does Inflation Vary by Income? Depends on How It’s Measured" Issue in Brief 22-16. Chestnut Hill, MA: Center for Retirement Research at Boston College.