
Using Ground Penetrating Radar and Resistivity Methods to Locate Unmarked Graves: A Review


1
Criminology Department, The University of Newcastle, Callaghan, NSW 2308, Australia
2
Archaeology, Flinders University, Adelaide, SA 5001, Australia
*
Author to whom correspondence should be addressed.
Remote Sens. 2021, 13(15), 2880; https://doi.org/10.3390/rs13152880
Submission received: 8 June 2021
/
Revised: 20 July 2021
/
Accepted: 20 July 2021
/
Published: 23 July 2021
(This article belongs to the Special Issue Advanced Ground Penetrating Radar Theory and Applications)
Abstract
:The location of unmarked graves in forensic and archaeological investigations is legally and culturally important. In a forensic context, locating covert burials of missing persons can provide closure to the family, as well as facilitating the successful prosecution of the individual(s) responsible. Archaeologically, burials provide an important source of information about health, diet, physical anthropology, and culture. Despite the importance of these features, the location of unmarked graves with conventional archaeological and forensic techniques, such as excavation, is difficult and expensive. As a result, geophysical techniques have been widely applied to the location of unmarked graves as they are non-invasive, cost and time effective, and avoid the unnecessary disturbance of human remains. This article brings together the literature on ground penetrating radar (GPR), and two resistivity methods, electrical resistivity tomography (ERT) and fixed probe resistivity (FPR), on their ability to locate burials and reviews their use in forensic and archaeological investigations. This paper aims to provide law enforcement personnel, archaeologists, geophysicists, and interested academics with an overview of how these techniques work, how they have been previously applied to grave detection, and the strengths and weakness of these methods.
1. Introduction
The location of unmarked burials is an important challenge for both forensic and archaeological investigations. In a forensic capacity, victims are sometimes buried in covert graves, which can be difficult to detect with a surface survey [1,2,3]. The location of a body is a critical component of forensic investigations, as it can provide closure to the family and friends and allow for a successful prosecution of the guilty party [3,4,5,6,7,8,9,10]. Firstly, the emotional and psychological consequences for families of missing individuals is very significant [8,11,12], as, even with the presumption that their loved one is deceased, many are unable to process their emotions and initiate the natural grief process [8]. Research has shown that ambiguity concerning the fate of their loved one may lead to psychological complaints such as post-traumatic stress disorder and prolonged grief disorder [12,13,14]. Secondly, although the presence of a body is not mandatory for a successful prosecution, legal precedent has shown that a defendant is more likely to receive a guilty verdict when the remains of the victim(s) have been found [9,15,16]. This is because the body itself is one of the most important pieces of evidence, and without it, the prosecution will need to present strong circumstantial evidence to prove beyond a reasonable doubt that a murder took place [9,15,16]. The location of unmarked burials is also important in an archaeological context, as graves are both a useful repository of archaeological information and an important cultural heritage resource [5].
Geophysical techniques are used to examine the subsurface by measuring various physical properties such as acoustic velocity, magnetic intensity, gravity, or electrical conductivity/resistivity [17]. These techniques are most commonly used for petroleum and mineral exploration but are also employed for engineering, environmental, and archaeological investigations [17]. The successful use of geophysics relies on the application of a technique that measures a physical property that is impacted by the target of the investigation [18]. When using geophysical techniques to locate unmarked graves, it is usually based on detecting disturbances to the soil stratigraphy, the location of voids, culture items associated with the burial or, rarely, the direct detection of skeletal material [19,20,21,22,23,24,25,26,27,28]. GPR is overwhelmingly the most commonly used geophysical technique for this purpose but resistivity, electromagnetic induction, magnetics, acoustic techniques, and gravity are also applied depending on the particular circumstance of the burial. Although the use of geophysical techniques for mapping unmarked graves has previously been the subject of a number of reviews, this work has unique merit in its discussions on using GPR and resistivity in a forensic capacity, as much of the GPR research focuses on archaeological investigations (see Barone et al. [29] for the latest advances in geophysics concerning archaeology and heritage management), and resistivity is most often used in an experimental rather than operational forensic context (see Section 6.1 and Section 6.2).
GPR works by transmitting electromagnetic energy into the ground, which is reflected back to antenna from changes in dielectric permittivity in the subsurface [30,31]. The principal advantages of GPR are that it can detect a wide range of different materials, can very quickly cover large areas, and is relatively unaffected by environmental noise [24,32,33,34]. The principal disadvantages of GPR are that conductive soils can significantly attenuate the signal leading to reduced depth penetration, the lower frequency antennas used to obtain deeper subsurface penetration may not provide sufficiently high-resolution information to locate graves, data collection may be impossible when surface obstructions are present, and that it requires specialist processing to be used effectively [24,32,34]. Nonetheless, GPR is almost ubiquitous as the geophysical method of choice for the detection of unmarked graves [35] and so has accumulated a voluminous literature for both forensic and archaeological investigations, summarised by Annan [31] and Conyers [30].
Resistivity works by measuring the electrical resistance of the subsurface between two current (used to inject electrical current) and two potential (used to measure potential difference) electrodes which are inserted into the ground [36]. ERT and FPR follow the same scientific principles; however, the acquisition is different. FPR uses a fixed electrode geometry that is moved around the survey area to provide a plan view representation of the electrical properties of the subsurface [36]. In contrast, in an ERT survey, the position and distance between the electrodes are varied to provide 1D–4D information about the surface, a process that is undertaken automatically by modern multi-electrode instruments. Because both methods measure the resistance of the subsurface, the name “resistivity” is often used interchangeably. For the purpose of this review, we use the term “resistivity” to refer to these methods collectively and ERT and FPR to refer to them individually. The principal advantage of resistivity is that the depth of penetration is rarely constrained by geological materials for forensic or archaeological investigations [5,37]. The main disadvantages are that the survey is much slower than GPR (mainly because of the need to insert electrodes into the ground), that the data obtained is of a lower resolution, the equipment is much less commonly available than GPR, and that some common archaeological and forensic features do not have a unique resistivity response.
2. Data Acquisition
2.1. GPR
GPR systems usually consist of a signal generator, transmitting and receiving antennae, and a monitor that can display real-time data of the subsurface being imaged (GPR unit in use demonstrated in Figure 1) [6,17,20,38,39,40]. The transmitting antenna emits electromagnetic (EM) waves into the ground, which are then reflected back to the receiving antenna as they encounter subsurface features with different dielectric properties [5,6,22,23,25,30,31,39]. Dielectric permittivity, which represents the degree of polarisation a material experiences under the influence of an external electric field and is conceptually very similar to conductivity, is principally controlled for subsurface materials by composition, water content, and porosity [39]. During a GPR survey, the EM waves will reflect back to the receiver at interfaces between different materials, such as changes in lithology, boundaries between natural and anthropogenic materials, and voids [24,30,41]. The greater the contrast in dielectric permittivity between these materials, the higher amplitude the GPR response. The reflections are recorded in a one-dimensional (1D) plot called a trace, which can then be combined with other traces to create a 2D profile, 3D cubes, and/or amplitude slice maps [5,23,25,42]. The receiving antenna also measures the time that the signal takes to return to the antenna and so, in combination with an estimation of the velocity properties of the subsurface, can provide an estimate of the depth of features of interest [5,23].
The antennae frequency used during data collection is important because it affects both the depth of penetration and the vertical resolution of the signal [22,25,43,44,45]. GPR antennae exist in a wide range of frequencies, ranging from ~50 MHz to ~2000 MHz [17,37,43,44,45]. Lower frequency antennae allow for a greater depth of penetration but have a lower resolution than higher frequency antennae [23]. Most forensic and archaeological investigations for the detection of unmarked graves are undertaken using antennae in the range of 250–900 MHz [46,47]. Technological developments have allowed for multi-frequency antennae, which provide multiple frequency data from the same survey, providing both high resolution and deeply penetrating outputs simultaneously [30]. Another recent development is the use of ‘hyperstacking’, in which each trace is collected many times and summed together to improve the signal-to-noise ratio, thus improving dynamic range limitations [48]. While frequency and other approaches can assist with obtaining a greater depth of penetration, this can still be limited by conductive materials and is dependent on moisture levels [30,39,49]. This limitation is somewhat ameliorated regarding the detection of unmarked graves because the most obvious physical and lithological evidence of soil disturbance is usually found in the upper 10 s of centimetres of the subsurface, regardless of the depth of the burial.
Another important factor to consider when performing a GPR survey is the trace increment and line spacing. To ensure that all targets are located, the line spacing should be no greater than ½ the shortest possible axis of the target, which when locating graves of adults is usually no more than 0.5 m [25,30,39]. Naturally, a higher line spacing results in high resolution data, but also increases the survey time [39]. This has been recently improved with the introduction of 3D GPR antennas (one antenna casing that contains multiple transmitters and receivers which provides high density 3D data and can be acquired using a motorised survey platform) [50,51].
2.2. Resistivity
Resistivity methods determine the electrical resistance of the subsurface [5,36,52] by measuring the electrical potential difference between two current and two potential electrodes in the ground [17,53]. The resistivity of earth materials is controlled by their composition, porosity, fluid saturation, and fluid chemistry [36]. By using multiple electrodes with different spacings, the electrical properties of the subsurface at a range of depths can be calculated [36]. Electrode spacing is important when setting up a resistivity survey, because the maximum data resolution is equal to the minimum electrode spacing. Additionally, an increased distance between the electrodes equates to an increased depth of penetration (but lower resolution data) [36,54]. Electrode configuration is equally important because the configuration of the current and potential electrodes also has a significant impact on the data resolution, sensitivity and signal ratio [52]. Common configurations (known as arrays) are Wenner, Schlumberger, pole–dipole, dipole–dipole, pole–pole, and the gradient [52].
To set up a single ERT line, multiple electrodes (most standard sets come with 64) are placed in the ground, equidistant and in a straight line across the midpoint of the grave/area of interest, and connected with a multi-core cable [52] (shown in Figure 2). The total length of an ERT line controls the maximum depth of survey, and the electrode spacing controls the resolution, with total penetration usually being 20% of the total line length [5,53]. The ERT software can be pre-programmed to collect resistivity data using multiple arrays that once started, should not be touched until completion. The collected data can then be presented in 1-, 2-, 3-, or 4D, depending on the purpose of the survey [52]. The switch from 1- to 2D surveys (switch from FPR to ERT) was facilitated by multi-electrode systems (the internal switch automatically changes between sets of four electrodes) and widely available personal computers to undertake data inversion [52]. 3D surveys can be collected in a true 3D configuration or multiple 2D lines that can be combined to create a 3D data cube [52].
In contrast, FPR in its simplest form consists of passing an electrical current through two current electrodes, and measuring the resulting voltage at two potential electrodes [52]. One current and one potential electrode remain stationary throughout the survey, whereas the other current and potential electrodes are moved around the site of interest at a fixed distance from each other, producing a 1D plan view of the subsurface features [52]. Figure 3 shows a traditional FPR system in use.
3. Data Processing
For both radar and resistivity techniques, data processing is essential to facilitate effective interpretation. Data processing aims to eliminate associated ‘noise’, remove artefacts that may make interpretation difficult, and improve the visibility of features that elicited a weak response [30,36]. Data processing should be undertaken judiciously and conservatively, only applying the minimum amount necessary to facilitate the aims of the survey [36,39,55]. In-depth discussions on data processing techniques can be found in Conyers [30] and Schmidt [36] for radar and resistivity, respectively.
3.1. GPR
The most common processing requirements for GPR are to remove very low frequency components of the data, increase the gain to make deeper parts of the profile visible, removing noise, and migrate point source hyperbolas [30]. Other processing objectives include correcting the orientation of steep dipping layers, optimising the interpretability of reflectors through frequency filtering and correcting for surface topography [30]. The methods that can be used to achieve these processing objectives can be found in Table 1.
More complicated methods of data processing can be used including predictive and deterministic deconvolution ringing (compresses noise and improves temporal resolution [56] or undertaking a Hilbert transform (identifies zones of conductivity contrast) [55,57].Common GPR processing software includes ReflexW [58], GPR-SLICE, RADAN, and (usually more limited) software produced by GPR instrument manufacturers.
An additional processing step for GPR data is to combine multiple 2D profiles into amplitude slices or 3D data cubes. Amplitude maps average the strength of the GPR response over a discrete depth within each trace and then display this as a 2D surface [30,59]. This method is most suitable for mapping features with linear geometry and high amplitude responses, as opposed to the more subtle responses related to stratigraphic features which are used to locate graves [60]. A further step is to create a 3D cube including all amplitude values for the survey, which can be displayed in any orientation [30].
3.2. Resistivity
The main difference between ERT and FPR data processing methods is the inversion process that ERT data undergoes [36]. The inversion mathematically models a depth section of estimated subsurface resistivity based on surface measurements of apparent resistance (an example of inverted ERT data can be seen in Figure 4) [36]. This is usually undertaken using a least-squares optimisation method however care is needed to ensure that the model uses appropriate smoothness constraints and is displayed using an appropriate colour scale [36,61]. Caution must also be taken if there are large differences between the raw data and the model, as this can mean that the data is unreliable [62]. The inversions have commonly been undertaken using the commercial software Res2D but there is increasing interest in open-source software such as BERT and ResIPy [63].
The need to process FPR data as summarized by Schmidt [36], can be for three reasons: data defects from problems with acquisition, highlighting weak anomalies that are important to the interpretation, and presenting the data in a way that the intended audience will understand. These issues can be ameliorated by data improvement, data processing, and image processing, respectively (summarized in Table 2) [36]. Software such as Geoplot and Snuffler can be used to process FPR data.
4. Data Interpretation
Once the geophysical data has been collected, processed, and displayed in an interpretable format, it needs to be interpreted to determine if it contains any features that are consistent with the size, shape, and depth of an unmarked grave. Effective data interpretation relies on having both a clear hypothetical model for what your target may look like (for which modelling software can be useful), and a comprehensive understanding of the geological and cultural history of the site. The key parameters that need to be considered for the effective interpretation of the presence of unmarked graves include the dimensions of the feature, the porosity, lithology, and water saturation/chemistry of the grave’s fill, the state of decomposition of the body, and whether any other materials (such as a void or a coffin) are expected to be present. A full discussion on data interpretation can be found in Conyers [30] for GPR and Schmidt [36] for Resistivity.
4.1. GPR
The principal challenge associated with GPR interpretation is that the subsurface is filled with anomalies that are not necessarily relevant to the detection of unmarked graves [30]. Further, the activities that produce anomalies in GPR associated with burials (i.e., soil disturbance) are produced by many other activities, such as natural animal, insect, or plant activity, or non-suspicious human activity such as water pipe maintenance [59]. In conjunction with analysing processed reflection profiles for anomalies, a combination of synthetic modelling, amplitude time slicing, and 3D feature rendering should be used for a more holistic method of data interpretation [30].
Synthetic modelling can be undertaken on 2D or 3D data outputs to model how specific earth materials will be resolved by a GPR survey, with the aim of facilitating more effective data interpretation [34]. The benefit of using scale model measurements from synthetic models as opposed to measurements made on the actual GPR, is the elimination of the ‘trenching effect’ (defined as the unknown difference in the electrical properties of the disturbed soil compared to the undisturbed soil) [64]. Modelling also allows the user to plan which antennae frequency to bring/use [64]. The open-source software GPRMax is now almost ubiquitous for GPR modelling and has been used in the investigation of the use of GPR in burial studies [65,66,67].
Effective 3D modelling of GPR data was done by Kelly and colleagues [68], which found that important subsurface features relating to the survey were found only on the 3D model. More specifically, a GPR survey was undertaken at a churchyard cemetery and then modelled in both 2- and 3D, with the 3D model highlighting companion burial plots and encircling burial sites that were not evident on the 2D model [68]. The authors also noted that both the 2- and 3D models were accurate reconstructions on the scene itself, further validating this type of data interpretation.
4.2. Resistivity
First and foremost, an effective interpretation relies on accurate knowledge of the site’s history, subsurface, and the approximate size and depth of the anomalies. This can be in the form of topographic maps, historic records regarding past land use, current records regarding recent land works (pipe installation/maintenance for example), and in a forensic case, police intelligence detailing the number, burial depth, and approximate size of the victims. Various geographic information system software’s that allow you to overlay multiple lines of geographic data can be helpful in determining the reason for a resistivity anomaly with a higher or lower resistance value than the background [36].
The interpretation of unmarked graves from resistivity data requires a conceptual model of how the presence of the burials will impact the resistivity of the subsurface. Ditches or graves will often exhibit a negative resistivity contrast because the in-filled soil is usually less compacted and hence has greater pore space to hold fluids, creating a lower resistivity than the soil surrounding it [36]. This is impart due to the trenching effect (elaborated on above), which is when uneven terrain may produce misleading anomalies [64,69]. If the grave is on a hill, in a ditch, or in itself very deep, the topography effects should be well understood and removed from the model before being interpreted [69]. It is important to note that graves will not always result in a negative contrast and will depend on the lithology of the grave fill and surrounding area, soil porosity, water saturation and fluid chemistry [36]. Modelling software such as Res2DMod are very useful for exploring how changes in the subsurface resistance values will impact the survey results.
5. Application to Grave Detection
5.1. GPR
GPR anomalies related to the presence of unmarked graves can occur in several forms. The most robust way to locate burials is to find disturbances to the soil stratigraphy related to digging the graves by imaging changes to the lithology and/or sedimentary structure [70,71]. In other cases the direct detection of graves might be possible based on the presence of hyperbola signals (high-amplitude reflections in a characteristic parabolic shape) where there is a high contrast in dielectric properties between the burial and the sounding material, such as an intact (particularly metal) coffin, metallic grave goods, the presence of a vault, void space inside the coffin or cadaver, or (very occasionally) from the skeletal material itself [19,20,21,22,23,24,30,37,72,73,74,75]. The use of hyperbolae for grave detection has, however, unfortunately been applied too widely, and includes many cases where no high contrast materials are likely to be present.
The effectiveness of a GPR survey when detecting graves will depend on variables such as soil composition, time since burial, as well as target composition, depth, and size [6,21,23,26,28,37,39,40,76,77,78,79]. Firstly, GPR equipment achieves the best penetration when used in sandy soils as opposed to those that are saline and/or clay-rich [23,25,37,39]. This was highlighted in Schultz and colleagues’ [25] research when, in sand, the GPR equipment was able to detect the burials at 21.5 months, even after skeletonization, whereas in clay, the burials were only detectable for the first six months, and difficult to detect afterwards even with the soft tissue present [25]. This is because the clay horizon masked the burials and the hyperbolic response from the cadavers appeared as natural undulations of the clay horizon [25]. Despite this, the most prospective zones for locating soil disturbance is the shallow subsurface where soil horizons are best developed, so clay soils are not always detrimental when using GPR for grave location [25].
Next, the time since burial is an important aspect when considering the detectability of the grave. An individual who has been recently buried and is undergoing active decomposition may be detectable because of the change in soil composition from decomposition products and/or because of the presence of a (semi) intact chest cavity [80]. Similarly, the backfill of recent burials may be more easily detected because the porosity contrast is greatest compared to the surrounding undisturbed soil, and there is little chance for pedogenesis to occur in the backfilled sediment [19,30]. Although more recent burials may be more detectable by GPR [74], it is still a useful technique when locating cemetery or archaeological burials. Dick and colleagues [81] found that progressively older burials were more difficult to detect with multi-frequency GPR (225 MHz–900 MHz); however, the surveys were able to locate the unmarked graves in three historic graveyards. The authors noted that geophysical techniques could potentially be used to date the burials, based on their geophysical response [81].
In discussing the target composition, research is not in agreement about what subsurface material is most commonly being detected by GPR. Schultz and Martin [46] found that when surveying simulated pig burials, the anomaly being detected was not the actual cadaver but the surrounding disturbed soil. Conversely, Schultz and colleagues [25] found that with similar burial conditions, the anomaly being detected was in fact the skeletal remains and not the soil disturbances. In both the above examples, the pig cadavers were buried ‘naked’, meaning that they were not buried in any material, such as tarpaulin. The use of tarpaulin to wrap the cadavers (done for forensic purposes, to simulate commonly found burials) retains fluids around the target and delays decomposition, making these targets easier to detect [82]. An example of a GPR survey used to locate simulated naked pig burials is shown in Figure 4. In rare cases the skeletal remains can be directly detected, such from a Viking Age site, dated to AD 1000 in Northern Iceland, and was hypothesized to be successful because of their excellent preservation [19]. Ultimately, the material being detected by GPR will vary case by case, and be dependent on variables such as soil composition, time since burial, and target composition.
The depth and size of the target are important considerations because both will dictate which antennae frequency and line spacing to use and can affect how the resulting anomalies are interpreted [23]. The average forensically significant burial will be less than one metre deep [40] while archaeological burials in some cultures often being buried at two meters deep. Therefore, depending on the purpose of the geophysical survey, different antennae frequencies may be employed. When considering appropriate line spacing, smaller targets buried closer to the surface will require smaller line spacing than those that are larger and buried deeper [83]. To exemplify this, Ruffell and colleagues [23] found that when locating a 156 year old cemetery, a lower frequency with a larger line spacing allowed for larger targets to be found, and a higher frequency with smaller line spacing was better for smaller objects [23]. When it comes to interpretation of the GPR data, knowledge of the depth and size of the target is beneficial, as this allows subsurface features with the same dimensions as the targeted human remains to be prioritised for further investigation. Conversely, if the size of the anomaly is smaller (or bigger) than the intended target, it can be eliminated as a point of interest.
The depth and size of the target are also important when discussing its detectability. In a study conducted by Schultz [84] looking at how GPR detects simulated graves containing small pig cadavers, the depth of the burial played a role in GPR’s ability to detect the grave anomaly. More specifically, the cadavers that were buried deeper were detectable for a longer amount of time, because decomposition was slower than cadavers buried in more shallow graves [84]. In the same study, and one similar using large pig cadavers [25], it was demonstrated that size also affected GPR’s ability to detect grave anomalies. More specifically, the large cadavers were able to be detected for almost two years (in sandy soils—only six months in clay), whereas the small cadavers were difficult to detect after they were skeletonized, as there was not a strong enough contrast in the area around the grave [84].
The physical environment of the survey area is also a significant determinant of the potential success of a GPR survey. GPR does not work well over uneven ground or areas with tall or dense vegetation, or large surface features [24,76,78,79] because of problems with inadequate ground coupling and site access. An additional constraint on effective grave detection is the presence of subsurface disturbance, such as animal burrows which can mask the presence of graves [82,83].
Along with the archaeological works mentioned in this review (such as [19,23,71,76,85,86]), GPR is commonly used for archaeological prospection when locating unmarked graves in cemeteries where the grave markers are no longer visible [74,76,77,87,88]. For example, Moffat and colleagues [88] used GPR at the historic Walkerville Wesleyan Cemetery in Australia and were able to locate 168 probable and 20 possible graves, and then 68 additional graves containing more than one interment. Other examples include Polymenakos [75] who found that a GPR survey over a prehistoric cemetery in Greece not only allowed practitioners to locate Late Bronze Age burials, but were also able to find and interpret other anomalies that were not graves, lending information to past burial practices. Similarly, Barone and colleagues [89] used GPR over the oldest section of a non-Catholic cemetery in Rome, which allowed for the corroboration of historic burial records, as well as the location of other documented but unmarked graves. Bladon and colleagues [87] note that using geophysics over cemeteries is not only to locate burials, but to ensure that they have not been disturbed, as well as being able to locate modern anthropogenic fill, indicating areas that may not be of archaeological interest [87]. Interestingly, not all burials associated with a cemetery are of archaeological significance. Ruffell [90] highlights this in a GPR search done in 2003 for a high-profile victim in a graveyard in Northern Ireland. Police and community intelligence stated that an individual linked to the 1969-1997 IRA (Irish Republican Army) campaign, may be buried there; however, negative GPR results and the body of the missing individual being found in a different location countered that [90].
5.2. Resistivity
Resistivity methods are able to detect graves because of the disturbed soil within the shaft that may have higher or lower resistivity values than the surrounding area [5]. The difference in values is controlled by lithology and porosity, as well as fluid saturation and chemistry [5,36]. If the shallow subsurface is extremely wet or extremely dry, this can make effective resistivity data collection (especially ERT) difficult [36]. In conjunction with soil composition, the effectiveness of an ERT survey when detecting graves will depend on variables such as time since burial, seasonal changes, target depth and composition, and the ground topography.
In relatively recent burials, the bodily fluids will mix with the surrounding soil increasing ion concentration in pore water, creating a conductive anomaly [5,53,91] (shown in Figure 4, as it also shows the ERT output of simulated pig graves only one month after burial). This was exemplified by Jervis and colleagues [92] who were able to detect a conductive anomaly due to the mixture of bodily fluids in the soil when using FPR to survey a buried pig cadaver over a period of six months. The authors found that this feature was detectable as a low resistivity anomaly from weeks four to 20 post-burial [92]. A similar study was done by Jervis et al. [53] with three burials, one with a ‘naked’ pig cadaver, one wrapped in tarpaulin and one empty grave, surveyed with FPR multiple times over a one-year period. The naked pig cadaver was detectable throughout the year, presumably because of the increase in groundwater conductivity from the decomposition fluids [53]. The resistivity response from the wrapped pig cadaver varied; it was initially very high between day 28 and 168, low from day 196 to 336, and then back to high on day 364 [53]. In congruity with similar field experiments, the authors stated that the resistivity levels were high due to the presence of the tarpaulin material, as well as the decomposition fluids inside the tarpaulin [53,91,92]. Once the decomposition fluids are no longer present in the soil, detecting the burials may become more difficult. This was shown by Dick and colleagues [81] who found that it was progressively difficult to detect older burials with ERT and GPR.
As the effectiveness of a resistivity survey is dependent on the amount of moisture in the soil, understanding seasonal changes and the accompanying moisture changes is beneficial. In experimental studies that span at least a year, the variability in the resistivity values may be due to the seasonal change, as the soil moisture content will vary with each passing season. Surveys done in the winter have a higher moisture content whereas in summer, there is a higher likelihood that the soils may dry out. This was demonstrated by Jervis and Pringle [93] when assessing the resistivity variation related to the soil moisture differences that accompany seasonal changes. Over three years, three simulated pig graves were surveyed using FPR [93]. The results showed that there was a repeating pattern of the residual volume of the grave resistivity features, most prominent between January and April, which are the months where the net gain of soil moisture is the highest (winter months in the northern hemisphere) [93].
Knowledge of the target depth and composition is useful because it will dictate the distance and array of the electrodes [36]. For ERT, the line is best placed in the middle of the subsurface feature, however, the depth of penetration will increase when the length of the line increases. The depth of penetration also increases when the distance between the electrodes increases as well. As for the targets themselves, resistivity may not be appropriate for delineating objects that are buried close together or overlapping because of the low data resolution compared to GPR [36]. As a result resistivity, and more specifically ERT, is not suitable for locating individual bodies within a mass grave; however, it is very useful for delineating the overall extent of these features, i.e., mapping the grave walls [94]. If the subsurface object being detected is of known size and shape (or a hypothesized size and shape), the spatial extents of the resulting anomaly may help to discern each individual feature.
With archaeologically significant burials, resistivity surveys can detect, in addition to grave related soil disturbance, subsurface features such as tombs, building foundations, walls, and coffins [5,26,53,91,95,96,97,98,99,100]. The detection of soil disturbances was demonstrated by Nero and colleagues [91] at a suspected royal cemetery at the Kwame Nkrumah University of Science and Technology in Ghana, wherein the ERT data demonstrated large resistivity variations in the near surface that were consistent with soil disturbances as well as high resistivity anomalies consistent with burial tombs and low resistivity anomalies consistent with naked burials [91]. Matias and colleagues [95] applied resistivity techniques to detect the tomb of Damião de Goes, a prominent humanist from 1574 in Portugal, which found high resistivity levels associated with the tomb walls, as well as low resistivity levels associated with the area in between that was enriched by ions from decomposition fluids. These results were corroborated by a full excavation, which found the tomb with several skeletal remains inside [95]. Various researchers in Greece demonstrated ERT’s ability to detect foundations and walls of ancient and historically important buildings both on land and submerged in water [96,97,98,99]. Finally, ERT techniques were used in South Australia to locate skeletal remains buried in a coffin that was approximately 150 years old, which found anomalous low resistivity values that were successfully retrieved upon excavation [26]. The lower resistivity levels around the coffin were likely attributed to the collection and retention of water [5,26].
The topography of the ground, both on the surface and subsurface, can affect the earth resistance measurements, largely due to differential drainage and the resistance topography effect [36]. Differential drainage is most commonly seen on the slopes of earth monuments such as hills or banks, and depending on the soil conditions and where the water is draining, certain areas of the topographic feature will present as higher or lower resistivity levels [36]. Knowledge of the topographic features and the drainage patterns will aid in a more accurate interpretation of the resistivity data [36]. The resistance topography effect describes the affect that topographic features have on the resulting earth resistance values [36]. Even in homogeneous ground, anomalies can present in the resistivity data that are simply from topographic features such as subsurface ditches [36]. Although the resistance topography effect can cause anomalies not related to the purpose of the survey (i.e., a burial), an experienced practitioner can differentiate the difference, as forensically or archaeologically significant anomalies will be detected beyond the limits of the topographic feature [36].
6. Discussion
6.1. GPR Versus Resistivity
The main principle behind radar and resistivity’s ability to locate graves is that the disturbed soil of the grave will be detected as an anomaly, differentiating it from the undisturbed soil around it. In certain situations, geophysical techniques can detect physical objects or features within the grave as well, including human remains/bodies, associated evidence, or archaeological artefacts. As these techniques both rely of mapping soil disturbance rather than directly locating bodies, it is imperative to conduct a thorough investigation, including the potential burial type, as well as the conditions of the soil, climate, and the burial itself, prior to commencing a geophysical survey. In a forensic context, this can mean obtaining information from witnesses and suspects about the last known whereabouts of the victim(s), as well as the items they may have had on/with them [6,24]. It is also important to understand the soil and climate conditions of the site, including the soil types, the presence of any large subsurface objects (large rocks or pipes for example), and the climate history.
GPR equipment can collect data points in a short amount of time with the highest resolution compared to any other geophysical technique [24,37,39,90,101]. It is a non-invasive method, meaning that there will be no disruption to the surrounding area and no destruction of potential subsurface evidence [24,25,26,40,49,101,102]. It is able to locate graves by imaging the disturbance of sedimentary structures, such as cross-beds, when there are no lithological changes [60]. GPR can be used on a variety of terrain, including dry, flat, and sandy soils, concrete and tarmac, and over fresh water [23,24,25,37,39]. Conversely, GPR is not optimal when detecting subsurface anomalies in clay-rich, high-salinity soil, areas that are uneven or full of tall or dense vegetation, as well as soils with subsurface disturbance [4,23,24,25,39,40,41]. Table 3 summarizes the research done by Schultz [24] and Miller [32] regarding the areas in which GPR can be successful and unsuccessful.
Ruffell and colleagues [103] note that as water covers two thirds of the planet, it is important to have techniques available to search the aqueous environments that may be concealing evidence (bodies and weapons) of a crime. The evolution of using GPR techniques to survey water began with walking the equipment over ice [104,105], to suspending radar antennae over bodies of water (to assess water flow) [106,107], and finally placing the GPR equipment on a boat or jetty [103,108,109]. The latter technique is now coined water penetrating radar (WPR), and despite its experimental success by Haeni et al. [108] and Sellmann et al. [109] in 1987 and 1992, respectively, very few real life uses or research articles have been published since [103]. One such example of a real-life use was in 2006, when Ruffell [110] published the successful use of a 200 MHz antenna locating a jet ski used in a water accident. The author used a 100, 200, and 400 MHZ antenna over a shallow lake in Northern Ireland, and noted that the 400 MHz antenna was unable to penetrate water deeper than 2m, and that the 100 and 200 MHz antennae produced high levels of ringing when penetrating deeper than 6 m [110]. As is consistent with using GPR over dry land, the best resolution with WPR is achieved when surveying shallow depths, and will not be useful in high salinity environments, such as salt water, or clay floors [103,111,112]. Contrary to dry land use (when searching for graves), using lower frequency antennae will achieve better results, with Forde et al. [112] stating that antennae between 100 and 500 MHz is best (with the lower end antennae producing optimal results) [103]. The little available research is in agreement that WPR is advantageous in rapidly surveying large bodies of fresh water, however, more needs to be understood about how EM waves react under water [103,111].
Resistivity methods are considerably less affected by the soil type and surface/subsurface obstructions (optimal and non-optimal survey areas summarized in Table 4) [5,36,37]. This was demonstrated by Wadsworth and colleagues [54] when GPR and magnetic surveys indicated potential building rubble in the subsurface, whereas the ERT results demonstrated a rather homogeneous subsurface, making it a useful tool to locate graves without confounding debris (that could skew the final interpretations). That being said, some resistivity survey results have proven problematic in dry, coarse-grained heterogeneous soils, as these conditions can mask target locations, or result in non-grave anomalies [37,113,114].
The most significant downside to resistivity is the extensive set up and data collection time, which when compared to GPR is approximately 100× slower for a single line with 25× less horizontal resolution. When looking at ERT and FPR specifically, the former is slower than the latter. Although this time constraint does not affect archaeological investigations (as these can span for weeks, months, and even years), forensic investigations are often time limited, thus being able to identify burials rapidly is a necessity, potentially excluding resistivity as a possible technique [86]. In this situation GPR can be used to rapidly survey a larger area, highlighting potential areas of interest that ERT or FPR can then further characterise for excavation.
Pringle and colleagues [40,113,115] demonstrated the advantages and disadvantages of using ERT and GPR on simulated graves using pig cadavers and plastic cast teaching skeletons. Studies published in 2012 and 2016 explored the geophysical techniques’ ability to detect clandestine graves in the short- (0–3 years) and long-term (4–6 years). These studies looked at both wrapped (in tarpaulin) and naked burials to emulate possible real-life situations [113,115]. The short-term results demonstrated that ERT consistently produced anomalies with lower resistivity than the surrounding soil when surveying the naked burial and higher resistivity than the surrounding soil when surveying the wrapped burial [113]. GPR was able to detect the wrapped burial throughout the 3 years; however, the amplitude of this anomaly continually reduced after approximately 2 years for all antennae frequencies [113]. Depending on the antenna frequency, the naked burial was detectable up to 12–15 months and difficult to detect after 18 months post burial [113]. With all antennae frequencies, the GPR data detected other, smaller anomalies that were not associated with the grave, making the naked burials harder to pinpoint [113]. The long-term results demonstrated that ERT was unable to detect the naked burial after 4 years but was able to consistently detect high resistivity anomalies over the wrapped burial related to soil disturbance during burial throughout years 4–6 [115]. Similarly, GPR was able to detect the wrapped burial throughout the entire period, but had difficulty detecting the naked burial, even at 225 MHz, which was found to be the optimal frequency [115].
In a similar study, Pringle and colleagues [40] created a simulated grave with a clothed plastic teaching skeleton, as well as animal products and physiological saline, in an urban environment. A series of GPR and ERT surveys were undertaken prior to burial, one month and then three months post burial [40]. In the GPR survey, an anomaly associated with the simulated grave was found on the one and three month surveys, that was notably absent on the control grave [40]. The ERT data demonstrated a low resistivity anomaly at the one month survey, which was more pronounced at the three month survey [40].
Most recently, Pringle et al. [10] used GPR, ERT (referred to as electrical resistivity imaging), and FPR to survey four simulated pig burials over a period of 10 years; a novel study in its field because of the length of survey time post burial, as well as the scope of geophysical and geological techniques utilized. The simulated graves were the same size and depth (~1.5 m length, 0.75 m width, and 0.6 m deep) and consisted of one naked burial, one wrapped in tarpaulin, one empty grave used as a control, and the fourth used for the electrical conductivity of grave soil water experiments [10]. The GPR surveys consisted of 2D profiles along two survey lines using 110 MHz, 225 MHz, 450 MHz, and 900 MHz antennae [10]. Data was collected every three months for the first six years, and then every year for the remaining four years [10]. The ERT surveys consisted of one 15.5 m line with 0.5 m electrode intervals, where data was collected every three months for the first six years, and then every year until the end of the monitoring period [10]. For all antennae frequencies, the GPR results demonstrated that the naked burial was poorly imaged as a low amplitude hyperbolic reflection only for the first six years, the wrapped burial was clearly detectable as a large hyperbolic reflection throughout the survey period, and the empty control burial produced only small hyperbolic reflections, probably related to tree roots or other subsurface, non-anthropogenic anomalies [10]. The ERT results demonstrated that the naked burial was detectable as a low resistivity anomaly up to four years and then difficult to detect afterwards, the wrapped burial was detectable as a high resistivity anomaly throughout the ten years, and the empty control burial was only detectable as a negative resistivity anomaly for the first year [10]. This study highlighted that when grave conditions are unknown, which is often the case in forensic investigations, using both GPR and resistivity methods is the optimal methodology when searching for buried remains [10].
The above noted ERT results, with regard to the conductive nature of the grave anomalies, would most likely be similar if undertaken by FPR. This as demonstrated by Jervis and colleagues [53,92], discussed in detail above in Section 5.2. In sum, the results were similar to [40,113,115], demonstrating that (recent) naked burials present as a low resistivity anomaly, and wrapped burials present as a high resistivity anomaly. These similarities indicate that the choice between using ERT or FPR comes down to equipment access, more so than one being better for grave location.
6.2. Forensic Versus Archaeological Burials
Both GPR and resistivity methods are useful for detecting graves (see Dick et al. [81] for a simplified schematic of typical geophysical targets for forensic and historic/archaeological graves) however the differing aims of archaeological and forensic surveys mean they may have slightly different methodological requirements. The main difference between forensic and archaeological investigations is that the results of the former may be used in a legal context [116]. For that reason, the methods of data acquisition, processing, and interpretation will be shaped by the strict evidentiary guidelines laid out by the court [37]. For example, although field documentation and survey protocols are equally as important in forensic and archaeological investigations, a lawyer can question the practitioner on their data collection and processing methodology, or degree expertise in the field, that can result in their testimony (and accompanying evidence) being deemed inadmissible. This can lead to an unfavourable outcome, such as the person(s) responsible being acquitted.
Firstly, it is important to note that both techniques will not only detect relevant (grave) anomalies but will also detect irrelevant ones, such as natural or anthropogenic subsurface disturbances unrelated to burials. This was evident in a geophysical survey conducted in New Zealand, where GPR and a shallow electromagnetic survey was done to locate human remains in a plantation forest [117]. The subsurface had been irregularly disrupted by tree harvesting, including partial removal of tree stumps, therefore the GPR survey detected many subsurface anomalies, most of which were not relevant to the burial containing the human remains [117]. Locating all subsurface anomalies in a forensic investigation can be problematic because the goal is usually to exclude as many potential anomalies as possible, to focus excavation on the covert burial. In contrast, in archaeological investigations, having all subsurface anomalies detected can be helpful because the goal is often to find all potential features to better understand the subsurface of the site. Despite these differences between forensic and archaeological investigations, survey parameters (such as line space and antennae frequency for GPR, and the distance and array of the electrodes for resistivity methods) can be the same.
Other important factors include the associated monetary and time costs. In general, undertaking a geophysical survey is expensive (high equipment and consultant costs) and requires a high level of training (or the use of a trained consultant) to be able to accurately collect and interpret subsurface anomalies [24,25,101]. Although it is highly dependent on the individual equipment specifications, new FPR, GPR (single frequency), and ERT equipment can be bought for less than AUD 5000, AUD 30,000, and AUD 50,000, respectively. The equipment can also be rented, which is generally 1% of the standard nominal purchase price. If those undertaking the survey are not trained in near surface geophysics, a consultant must be utilized which can be expensive depending on the length of the survey and size of the survey site. That, combined with the time necessary to complete a geophysical survey (especially with ERT [5]—see GPR versus resistivity section above) and the availability of the equipment has resulted in limited opportunities to utilize these techniques. Schultz [24] discusses the importance of forming good relationships between law enforcement, archaeological companies, and universities, as those most highly trained will be academics who can then utilize their expertise (and sometimes equipment) for law enforcement and archaeological purposes [24,41].
6.3. Uses in Forensic Investigations
Due to the more stringent time and cost barriers associated with forensic investigations, as well as the importance surrounding evidence admissibility [37], there has been an abundance of published works on GPR and resistivity used for archaeological purposes (referenced and discussed above) but significantly less in a forensic context. For each technique, the forensic applications have been primarily experimental (see GPR versus resistivity section). That being said, a comprehensive literature review highlighted the following recent forensic surveys in which GPR, and resistivity methods were used.
In Italy in 2013, an individual went missing and was hypothesized to be buried in one of the many surrounding caves [118]. A GPR survey was conducted which successfully found the person in question, as well as being able to provide information on the subsurface geological features [118]. In Spain in 2011, GPR was used over a mountainous environment in an attempt to locate the skeletal remains of an individual that had gone missing 10-20 years prior [65]. This use of GPR highlighted the challenges associated with using this technique on a difficult terrain, including its inability to detect subsurface features with centimetre precision [65]. That being said, the authors report that the 3D imaging of the GPR data, complimented with the 2D analysis, was helpful in the final data interpretation [65]. In 2009, Billinger [119] conducted a GPR survey over the concrete basement floor of a residential dwelling where the body of a missing person was presumed to be. Although the GPR results highlighted an anomaly consistent with a burial, the excavation produced negative results, as no body was found [119]. This article highlights two important points, firstly, GPR can be successfully used over various types of surfaces (such as concrete), secondly however, not all anomalies that are consistent with a burial will be so upon excavation. Finally, in 2014, a phased site investigation that included GPR successfully located human remains associated with the Spanish Civil War [120]. Although the excavation was halted, the authors successfully demonstrated that GPR, accompanied with remote sensing and case specific intelligence gathering, can locate those lost in situations of violent conflict that often result in hundreds of thousands of deaths [120].
In Adelaide (Australia), in 2018, GPR and ERT were used in an attempt to locate burials of the Beaumont children, three siblings that went missing in 1966 from a beach in South Australia [121]. The GPR survey was unable to locate any anomalies associated with burials because of the presence of complex anthropogenic sediments on the site; however, the ERT survey was successful in detecting a subsurface anomaly that was consistent with the size, shape and depth of a burial that could have contained three small children [121]. Although upon excavation, only animal bones and rubbish were found, this was the first time ERT had been used in a forensic capacity in Australia and successfully highlighted its potential for locating clandestine burials on other sites [121,122].
Published in 2020, Molina and colleagues [123] aided Colombian forensic investigators with the search for the burials of the missing persons associated with human rights atrocities 14 year prior. ERT was used to survey a mountainous area, as well as the grounds of a former school, both of which were in poor condition and difficult to access [123]. A low resistivity anomaly was found in the mountainous area; however, upon excavation, it was found to be a rock [123]. At the former school site, ERT identified two high resistivity anomalies, one which was deemed too large to be human made therefore not excavated, and a second that contained bovine remains [123]. Although the remains of those affected by the atrocities were not found, this was the first time that a geophysical approach was taken in Colombia for forensic investigations, which can now be used by forensic investigators to survey other sites of interest [123].
As for FPR, in Texas (USA) in 1878, the infamous gunman William Longley was rumoured to be hung with his final resting place unknown [124]. A mixture of probing, coring, and resistivity methods were utilized which resulted in finding 34 unmarked graves [124]. Of the 34 unmarked graves, 21 were excavated with no success in locating Longley’s grave [124]. Although the purpose of the survey was not fulfilled, this example highlighted the effectiveness of using ERT in a cemetery location, despite encountered problems such as modern burials scattered all around the site and grave fill over half of the site [124]. In Wales (UK) in 2008, the case of a missing female victim was investigated using ERT techniques [125]. In total, the survey identified 121 anomalies, with 25 of those being denoted as a priority [125]. Of the 25 priority anomalies, seven were recommended for excavation [125]. Despite being recommended, these seven areas were never excavated because the victim’s grave was found before any excavations could take place; however, the authors believe that had the high priority positions that were identified been excavated sooner, they could have been eliminated and other areas of interest could have been explored [125]. This highlights FPR’s ability to narrow down larger scenes to be able to provide police with a prioritized list of excavation spots [125].
7. Conclusions
The location of burials is a critical research question in archaeology and forensic investigations [1,4,5,6,126]; however, excavation can be expensive, destructive, culturally inappropriate, and disruptive [5,10,127]. Geophysical techniques provide a non-invasive and relatively rapid alternative, however, for the best results, they must be used with judicious consideration of site conditions. Pringle et al. [10] provide an excellent table detailing whether a forensically significant grave’s detectability was good, medium, or poor, over a ten year period for both GPR and ERT, and should be reviewed by investigators before undertaking a geophysical survey. For archaeologists, Dick and colleagues [81] created a similar table detailing how well GPR and ERT were able to detect older burials. The literature supports that GPR works best for almost any survey, particularly in flat, dry, and sandy soils with minimal surface and subsurface features; however, resistivity methods should be used in areas where GPR falls short, including in clay-rich, high salinity soils, where great depth is required, and locations with tall or dense vegetation and gravestones.
Due to the high dependence on site specific conditions, it is imperative that control studies be done in different areas and countries so that an informed decision on which technique is most appropriate to use can be made, facilitating an accurate interpretation of the data [37]. This is especially important when being used in a forensic context, firstly, as all scientific evidence will be subject to stringent evidentiary rules concerning their admissibility [37], but more importantly, to be able locate and reunite a missing individual with their loved ones. Although there are optimal and non-optimal sites to use GPR and resistivity, it is important to note that a multi-geophysical technique approach is always best if possible [128].
Author Contributions
Conceptualization, V.B., X.M., J.E. and I.M.; writing—original draft preparation, V.B., X.M., J.E. and I.M.; writing—review and editing, V.B., X.M., J.E. and I.M.; supervision, X.M., J.E. and I.M.; funding acquisition, V.B. All authors have read and agreed to the published version of the manuscript.
Funding
This research was funded by a University of Newcastle Vice Chancellor’s Higher Degree by Research PhD Training Scholarship and a Social Sciences and Humanities Research Council (SSHRC) Doctoral Fellowship (751-2021-0039). Dr Ian Moffat was supported by a Flinders University Research Investment fund grant and Dr Ian Moffat and Associate Professor Xanthé Mallett were supported by Australian Research Council grant #LE210100037.
Conflicts of Interest
The authors declare no conflict of interest. The funders had no role in the design of the study; in the collection, analyses, or interpretation of data; in the writing of the manuscript, or in the decision to publish the results.
References
- Hansen, J.D.; Pringle, J.K.; Goodwin, J. GPR and bulk ground resistivity surveys in graveyards: Locating unmarked burials in contrasting soil types. Forensic Sci. Int. 2014, 237, e14–e29. [Google Scholar] [CrossRef] [Green Version]
- Pringle, J.K.; Cassella, J.P.; Jervis, J.R.; Williams, A.; Cross, P.; Cassidy, N.J. Soilwater conductivity analysis to date and locate clandestine graves of homicide victims. J. Forensic Sci. 2015, 60, 1052–1060. [Google Scholar] [CrossRef] [Green Version]
- Powell, K. Grave Concerns: Locating and Unearthing Human Bodies; Australian Academic Press: Queensland, Australia, 2010. [Google Scholar]
- Ruffell, A.; McKinley, J. Forensic geoscience: Applications of geology, geomorphology and geophysics to criminal investigations. Earth-Sci. Rev. 2005, 69, 235–247. [Google Scholar] [CrossRef] [Green Version]
- Moffat, I. Locating Graves with Geophysics; Archaeopress Publishing Ltd.: Oxford, UK, 2015. [Google Scholar]
- Larson, D.O.; Vass, A.A.; Wise, M. Advanced scientific methods and procedures in the forensic investigation of clandestine graves. J. Contemp. Crim. Justice 2011, 27, 149–182. [Google Scholar] [CrossRef]
- Watson, C.J.; Ueland, M.; Schotsmans, E.M.; Sterenberg, J.; Forbes, S.L.; Blau, S. Detecting grave sites from surface anomalies: A longitudinal study in an Australian woodland. J. Forensic Sci. 2020, 66, 479–490. [Google Scholar] [CrossRef] [PubMed]
- Lenferink, L.I.; de Keijser, J.; Wessel, I.; de Vries, D.; Boelen, P.A. Toward a better understanding of psychological symptoms in people confronted with the disappearance of a loved one: A systematic review. Trauma Violence Abus. 2019, 20, 287–302. [Google Scholar] [CrossRef] [Green Version]
- Ferguson, C.; Pooley, K. Australian no-body homicides: Exploring common features of solved cases. J. Forensic Leg. Med. 2019, 66, 70–78. [Google Scholar] [CrossRef]
- Pringle, J.K.; Stimpson, I.G.; Wisniewski, K.D.; Heaton, V.; Davenward, B.; Mirosch, N.; Spencer, F.; Jervis, J.R. Geophysical monitoring of simulated homicide burials for forensic investigations. Sci. Rep. 2020, 10, 1–12. [Google Scholar] [CrossRef]
- Isuru, A.; Hewage, S.; Bandumithra, P.; Williams, S. Unconfirmed death as a predictor of psychological morbidity in family members of disappeared persons. Psychol. Med. 2019, 49, 2764–2771. [Google Scholar] [CrossRef]
- Lenferink, L.I.; de Keijser, J.; Wessel, I.; Boelen, P.A. Cognitive-behavioral correlates of psychological symptoms among relatives of missing persons. Int. J. Cogn. Ther. 2018, 11, 311–324. [Google Scholar] [CrossRef] [Green Version]
- Heeke, C.; Stammel, N.; Knaevelsrud, C. When hope and grief intersect: Rates and risks of prolonged grief disorder among bereaved individuals and relatives of disappeared persons in Colombia. J. Affect. Disord. 2015, 173, 59–64. [Google Scholar] [CrossRef]
- Kennedy, C.; Deane, F.P.; Chan, A.Y. “What Might Have Been…”: Counterfactual Thinking, Psychological Symptoms and Posttraumatic Growth When a Loved One is Missing. Cogn. Ther. Res. 2021, 45, 322–332. [Google Scholar] [CrossRef]
- DiBiase, T.A.T. No-Body Homicide Cases: A Practical Guide to Investigating, Prosecuting, and Winning Cases When the Victim is Missing; CRC Press: Boca Raton, FL, USA, 2014. [Google Scholar]
- Ferguson, C.; Pooley, K. Comparing solved and unsolved no-body homicides in Australia: An exploratory analysis. Homicide Stud. 2019, 23, 381–403. [Google Scholar] [CrossRef]
- Reynolds, J.M. An Introduction to Applied and Environmental Geophysics, 2nd ed.; John Wiley & Sons: West Sussex, UK, 2011. [Google Scholar]
- Telford, W.; Geldart, L.; Sheriff, R. Applied Geophysics; Cambridge University Press: Cambridge, UK, 1990. [Google Scholar]
- Damiata, B.N.; Steinberg, J.M.; Bolender, D.J.; Zoëga, G. Imaging skeletal remains with ground-penetrating radar: Comparative results over two graves from Viking Age and Medieval churchyards on the Stóra-Seyla farm, northern Iceland. J. Archaeol. Sci. 2013, 40, 268–278. [Google Scholar] [CrossRef]
- Schultz, J.J.; Dupras, T.L. The contribution of forensic archaeology to homicide investigations. Homicide Stud. 2008, 12, 399–413. [Google Scholar] [CrossRef]
- King, J.A.; Bevan, B.W.; Hurry, R.J. The reliability of geophysical surveys at historic-period cemeteries: An example from the Plains Cemetery, Mechanicsville, Maryland. Hist. Archaeol. 1993, 27, 4–16. [Google Scholar] [CrossRef]
- Conyers, L.B. Ground-penetrating radar techniques to discover and map historic graves. Hist. Archaeol. 2006, 40, 64–73. [Google Scholar] [CrossRef]
- Ruffell, A.; McCabe, A.; Donnelly, C.; Sloan, B. Location and assessment of an historic (150–160 years old) mass grave using geographic and ground penetrating radar investigation, NW Ireland. J. Forensic Sci. 2009, 54, 382–394. [Google Scholar] [CrossRef]
- Schultz, J.J. Using ground-penetrating radar to locate clandestine graves of homicide victims: Forming forensic archaeology partnerships with law enforcement. Homicide Stud. 2007, 11, 15–29. [Google Scholar] [CrossRef]
- Schultz, J.J.; Collins, M.E.; Falsetti, A.B. Sequential monitoring of burials containing large pig cadavers using ground-penetrating radar. J. Forensic Sci. 2006, 51, 607–616. [Google Scholar] [CrossRef] [PubMed]
- Powell, K. Detecting buried human remains using near-surface geophysical instruments. Explor. Geophys. 2004, 35, 88–92. [Google Scholar] [CrossRef]
- Hammon III, W.S.; McMechan, G.A.; Zeng, X. Forensic GPR: Finite-difference simulations of responses from buried human remains. J. Appl. Geophys. 2000, 45, 171–186. [Google Scholar] [CrossRef]
- Nobes, D.C. Geophysical surveys of burial sites: A case study of the Oaro urupa. Geophysics 1999, 64, 357–367. [Google Scholar] [CrossRef]
- Barone, P.M.; Ruffell, A.; Tsokas, G.N.; Rizzo, E. Geophysical Surveys for Archaeology and Cultural Heritage Preservation. Heritage 2019, 2, 174. [Google Scholar] [CrossRef] [Green Version]
- Conyers, L. Ground-Penetrating Radar for Archaeology; AltaMira Press: Lanham, MD, USA, 2013; Volume 4. [Google Scholar]
- Annan, A.P. Electromagnetic Principles of Ground Penetrating Radar. In Ground Penetrating Radar: Theory and Applications, 1st ed.; Jol, H.M., Ed.; Elsevier Science: Oxford, UK, 2009; pp. 3–40. [Google Scholar]
- Miller, P.S. Disturbances in the soil: Finding buried bodies and other evidence using ground penetrating radar. J. Forensic Sci. 1996, 41, 648–652. [Google Scholar] [CrossRef] [PubMed]
- Ruffell, A.; McKinley, J. Geoforensics; John Wiley & Sons: West Sussex, UK, 2008. [Google Scholar]
- Giannopoulos, A. Modelling ground penetrating radar by GprMax. Constr. Build. Mater. 2005, 19, 755–762. [Google Scholar] [CrossRef]
- Aziz, A.S.; Stewart, R.R.; Green, S.L.; Flores, J.B. Locating and characterizing burials using 3D ground-penetrating radar (GPR) and terrestrial laser scanning (TLS) at the historic Mueschke Cemetery, Houston, Texas. J. Archaeol. Sci. Rep. 2016, 8, 392–405. [Google Scholar] [CrossRef]
- Schmidt, A. Earth resistance for archaeologists; AltaMira Press: Lanham, MD, USA, 2013; Volume 3. [Google Scholar]
- Pringle, J.; Ruffell, A.; Jervis, J.; Donnelly, L.; McKinley, J.; Hansen, J.; Morgan, R.; Pirrie, D.; Harrison, M. The use of geoscience methods for terrestrial forensic searches. Earth-Sci. Rev. 2012, 114, 108–123. [Google Scholar] [CrossRef]
- Cassidy, N.J. Electrical and Magnetic Properties of Rocks, Soils and Fluids. In Ground Penetrating Radar: Theory and Applications, 1st ed.; Jol, H.M., Ed.; Elsevier Science: Oxford, UK, 2009; pp. 41–72. [Google Scholar]
- Bristow, C.S.; Jol, H.M. Ground Penetrating Radar in Sediments; Geological Society of London: London, UK, 2003. [Google Scholar]
- Pringle, J.K.; Jervis, J.; Cassella, J.P.; Cassidy, N.J. Time-lapse geophysical investigations over a simulated urban clandestine grave. J. Forensic Sci. 2008, 53, 1405–1416. [Google Scholar] [CrossRef]
- Abate, D.; Sturdy Colls, C.; Moyssi, N.; Karsili, D.; Faka, M.; Anilir, A.; Manolis, S. Optimizing search strategies in mass grave location through the combination of digital technologies. Forensic Sci. Int. Synerg. 2019, 1, 95–107. [Google Scholar] [CrossRef]
- Goodman, D.; Nishimura, Y.; Rogers, J.D. GPR time slices in archaeological prospection. Archaeol. Prospect. 1995, 2, 85–89. [Google Scholar]
- Bloemenkamp, R.; Slob, E. The effect of the elevation of GPR antennas on data quality. In Proceedings of the 2nd International Workshop on Advanced Ground Penetrating Radar, Delft, The Netherlands, 14–16 May 2003; pp. 201–206. [Google Scholar]
- Millard, S.G.; Shaari, A.; Bungey, J. Field pattern characteristics of GPR antennas. NDT E Int. 2002, 35, 473–482. [Google Scholar] [CrossRef] [Green Version]
- Millard, S.G.; Shaari, A.; Bungey, J. Resolution of GPR bow-tie antennas. In Proceedings of the Ninth International Conference on Ground Penetrating Radar, Santa Barbara, CA, USA, 29 April–2 May 2002; pp. 724–730. [Google Scholar]
- Schultz, J.J.; Martin, M.M. Controlled GPR grave research: Comparison of reflection profiles between 500 and 250 MHz antennae. Forensic Sci. Int. 2011, 209, 64–69. [Google Scholar] [CrossRef]
- Buck, S. Searching for graves using geophysical technology: Field tests with ground penetrating radar, magnetometry, and electrical resistivity. J. Forensic Sci. 2003, 48, 1–7. [Google Scholar] [CrossRef]
- Feigin, J.; Cist, D. Evaluating the effectiveness of hyperstacking for GPR surveys. In Proceedings of the Symposium on the Application of Geophysics to Engineering and Environmental Problems, Denver, CO, USA, 20–24 March 2016; pp. 265–270. [Google Scholar]
- Davenport, G.C. Remote sensing applications in forensic investigations. Hist. Archaeol. 2001, 35, 87–100. [Google Scholar] [CrossRef]
- Schneidhofer, P.; Nau, E.; Leigh McGraw, J.; Tonning, C.; Draganits, E.; Gustavsen, L.; Trinks, I.; Filzwieser, R.; Aldrian, L.; Gansum, T.; et al. Geoarchaeological evaluation of ground penetrating radar and magnetometry surveys at the Iron Age burial mound Rom in Norway. Archaeol. Prospect. 2017, 24, 425–443. [Google Scholar] [CrossRef]
- Trinks, I.; Hinterleitner, A.; Neubauer, W.; Nau, E.; Löcker, K.; Wallner, M.; Gabler, M.; Filzwieser, R.; Wilding, J.; Schiel, H.; et al. Large-area high-resolution ground-penetrating radar measurements for archaeological prospection. Archaeol. Prospect. 2018, 25, 171–195. [Google Scholar] [CrossRef]
- Loke, M.; Chambers, J.; Rucker, D.; Kuras, O.; Wilkinson, P. Recent developments in the direct-current geoelectrical imaging method. J. Appl. Geophys. 2013, 95, 135–156. [Google Scholar] [CrossRef]
- Jervis, J.R.; Pringle, J.K.; Tuckwell, G.W. Time-lapse resistivity surveys over simulated clandestine graves. Forensic Sci. Int. 2009, 192, 7–13. [Google Scholar] [CrossRef]
- Wadsworth, W.T.; Bank, C.-G.; Patton, K.; Doroszenko, D. Forgotten Souls of the Dawn Settlement: A Multicomponent Geophysical Survey of Unmarked Graves at the British American Institute Cemetery. Hist. Archaeol. 2020, 54, 624–646. [Google Scholar] [CrossRef]
- Cassidy, N.J. Ground penetrating radar data processing, modelling and analysis. In Ground Penetrating Radar: Theory and Applications; Jol, H.M., Ed.; Elsevier Science: Oxford, UK, 2009; pp. 141–176. [Google Scholar]
- Xia, J.; Franseen, E.K.; Miller, R.D.; Weis, T.V.; Byrnes, A.P. Improving ground-penetrating radar data in sedimentary rocks using deterministic deconvolution. J. Appl. Geophys. 2003, 54, 15–33. [Google Scholar] [CrossRef]
- Pujari, P.R.; Pardhi, P.; Muduli, P.; Harkare, P.; Nanoti, M.V. Assessment of pollution near landfill site in Nagpur, India by resistivity imaging and GPR. Environ. Monit. Assess. 2007, 131, 489–500. [Google Scholar] [CrossRef] [PubMed]
- Sandmeier, G.R. Reflexw—GPR and Seismic Processing Software. Available online: https://www.sandmeier-geo.de/reflexw.html (accessed on 9 December 2020).
- Conyers, L.B. Interpreting Ground-Penetrating Radar for Archaeology; Routledge: London, UK, 2012. [Google Scholar]
- Sarris, A.; Kalayci, T.; Moffat, I.; Manataki, M. An introduction to Geophysical and Geochemical Methods in Digital Geoarchaeology. In Digital Geoarchaeology; Siart, C., Forbriger, M., Bubenzer, O., Wagner, G., Miller, C.E., Schutkowski, H., Eds.; Natural Science in Archaeology; Springer: Cham, Switzerland, 2018; pp. 215–236. [Google Scholar]
- Loke, M.; Barker, R. Least-squares deconvolution of apparent resistivity pseudosections. Geophysics 1995, 60, 1682–1690. [Google Scholar] [CrossRef]
- Loke, M.H.; Barker, R.D. Rapid least-squares inversion of apparent resistivity pseudosections by a quasi-Newton method1. Geophys. Prospect. 1996, 44, 131–152. [Google Scholar] [CrossRef]
- Blanchy, G.; Saneiyan, S.; Boyd, J.; McLachlan, P.; Binley, A. ResIPy, an intuitive open source software for complex geoelectrical inversion/modeling. Comput. Geosci. 2020, 137, 104423. [Google Scholar] [CrossRef]
- Bourgeois, J.M.; Smith, G.S. A fully three-dimensional simulation of a ground-penetrating radar: FDTD theory compared with experiment. IEEE Trans. Geosci. Remote Sens. 1996, 34, 36–44. [Google Scholar] [CrossRef]
- Novo, A.; Lorenzo, H.; Rial, F.I.; Solla, M. 3D GPR in forensics: Finding a clandestine grave in a mountainous environment. Forensic Sci. Int. 2011, 204, 134–138. [Google Scholar] [CrossRef]
- Özkap, K.; Pekşen, E.; Kaplanvural, İ.; Çaka, D. 3D scanner technology implementation to numerical modeling of GPR. J. Appl. Geophys. 2020, 179, 1–8. [Google Scholar] [CrossRef]
- Booth, A.D.; Pringle, J.K. Semblance analysis to assess GPR data from a five-year forensic study of simulated clandestine graves. J. Appl. Geophys. 2016, 125, 37–44. [Google Scholar] [CrossRef]
- Kelly, T.; Angel, M.; O’Connor, D.; Huff, C.; Morris, L.; Wach, G. A novel approach to 3D modelling ground-penetrating radar (GPR) data—A case study of a cemetery and applications for criminal investigation. Forensic Sci. Int. 2021, 1–15. [Google Scholar] [CrossRef]
- Lu, D.-B.; Zhou, Q.-Y.; Junejo, S.; Xiao, A.-L. A systematic study of topography effect of ERT based on 3-D modeling and inversion. Pure Appl. Geophys. 2015, 172, 1531–1546. [Google Scholar] [CrossRef]
- Jenny, H. Factors of Soil Formation: A System of Quantitative Pedology; Dover Publications, Inc.: New York, NY, USA, 1994. [Google Scholar]
- Panisova, J.; Fraštia, M.; Wunderlich, T.; Pašteka, R.; Kušnirák, D. Microgravity and Ground-penetrating Radar Investigations of Subsurface Features at the St Catherine’s Monastery, Slovakia. Archaeol. Prospect. 2013, 20, 163–174. [Google Scholar] [CrossRef]
- Ambos, E.L.; Larson, D.O. Verification of virtual excavation using multiple geophysical methods. SAA Archaeol. Rec. 2002, 2, 32–38. [Google Scholar]
- Bevan, B.W. The search for graves. Geophysics 1991, 56, 1310–1319. [Google Scholar] [CrossRef]
- Doolittle, J.A.; Bellantoni, N.F. The search for graves with ground-penetrating radar in Connecticut. J. Archaeol. Sci. 2010, 37, 941–949. [Google Scholar] [CrossRef]
- Polymenakos, L. Searching for prehistoric small-sized graves in complex geoarchaeological conditions: Ayios Vasilios North Cemetery (Peloponnese, Greece). J. Archaeol. Sci. Rep. 2019, 24, 1–15. [Google Scholar] [CrossRef]
- Moffat, I.; Garnaut, J.; Jordan, C.; Vella, A.; Bailey, M. Ground penetrating radar investigations at the Lake Condah Mission Cemetery: Locating unmarked graves in areas with extensive subsurface disturbance. Artefact J. Archaeol. Anthropol. Soc. Vic. 2018, 39, 8–14. [Google Scholar] [CrossRef]
- Marshallsay, J.; Moffat, I.; Beale, A. Geophysical Investigations of the Tabernacle (Yilki) Cemetery, Encounter Bay, South Australia. J. Anthropol. Soc. South Aust. 2012, 35, 91–103. [Google Scholar]
- Moffat, I.; Wallis, L.A.; Hounslow, M.W.; Niland, K.; Domett, K.; Trevorrow, G. Geophysical prospection for late Holocene burials in coastal environments: Possibilities and problems from a pilot study in South Australia. Geoarchaeology 2010, 25, 645–665. [Google Scholar] [CrossRef]
- Wallis, L.A.; Moffat, I.; Trevorrow, G.; Massey, T. Locating places for repatriated burial: A case study from Ngarrindjeri ruwe, South Australia. Antiquity 2008, 82, 750–760. [Google Scholar] [CrossRef] [Green Version]
- Killam, E.W. The Detection of Human Remains, 2nd ed.; Charles C Thomas Publisher, Ltd.: Springfield, MO, USA, 2004. [Google Scholar]
- Dick, H.C.; Pringle, J.K.; Wisniewski, K.D.; Goodwin, J.; van der Putten, R.; Evans, G.T.; Francis, J.D.; Cassella, J.P.; Hansen, J.D. Determining geophysical responses from burials in graveyards and cemeteries. Geophysics 2017, 82, B245–B255. [Google Scholar] [CrossRef] [Green Version]
- Schultz, J.J.; Martin, M.M. Monitoring controlled graves representing common burial scenarios with ground penetrating radar. J. Appl. Geophys. 2012, 83, 74–89. [Google Scholar] [CrossRef]
- Goodman, D.; Piro, S.; Nishimura, Y.; Schneider, K.; Hongo, H.; Higashi, N.; Steinberg, J.; Damiata, B. GPR Archaeometry. In Ground Penetrating Radar Theory and Applications; Jol, H.M., Ed.; Elsevier Science: Oxford, UK, 2008; pp. 479–508. [Google Scholar]
- Schultz, J.J. Sequential monitoring of burials containing small pig cadavers using ground penetrating radar. J. Forensic Sci. 2008, 53, 279–287. [Google Scholar] [CrossRef]
- Persson, K.; Olofsson, B. Inside a mound: Applied geophysics in archaeological prospecting at the Kings’ Mounds, Gamla Uppsala, Sweden. J. Archaeol. Sci. 2004, 31, 551–562. [Google Scholar] [CrossRef]
- Dick, H.C.; Pringle, J.K.; Sloane, B.; Carver, J.; Wisniewski, K.D.; Haffenden, A.; Porter, S.; Roberts, D.; Cassidy, N.J. Detection and characterisation of Black Death burials by multi-proxy geophysical methods. J. Archaeol. Sci. 2015, 59, 132–141. [Google Scholar] [CrossRef] [Green Version]
- Bladon, P.; Moffat, I.; Guilfoyle, D.; Beale, A.; Milani, J. Mapping anthropogenic fill with GPR for unmarked grave detection: A case study from a possible location of Mokare’s grave, Albany, Western Australia. Explor. Geophys. 2011, 42, 249–257. [Google Scholar] [CrossRef] [Green Version]
- Moffat, I.; Linsell, J.; Vella, A.; Duke, B.; Kowlessar, J.; Griffith, J.G.; Down, A. Mapping unmarked graves with Ground Penetrating Radar at the Walkerville Wesleyan Cemetery, Adelaide. Aust. Archaeol. 2020, 86, 57–62. [Google Scholar] [CrossRef]
- Barone, P.; Swanger, K.; Stanley-Price, N.; Thursfield, A. Finding graves in a cemetery: Preliminary forensic GPR investigations in the non-Catholic cemetery in Rome (Italy). Measurement 2016, 80, 53–57. [Google Scholar] [CrossRef]
- Ruffell, A. Searching for the IRA” disappeared”: Ground-penetrating radar investigation of a churchyard burial site, Northern Ireland. J. Forensic Sci. 2005, 50, 1430–1435. [Google Scholar] [CrossRef] [PubMed] [Green Version]
- Nero, C.; Aning, A.A.; Danuor, S.K.; Noye, R.M. Delineation of graves using electrical resistivity tomography. J. Appl. Geophys. 2016, 126, 138–147. [Google Scholar] [CrossRef]
- Jervis, J.R.; Pringle, J.K.; Cassella, J.P.; Tuckwell, G. Using soil and groundwater data to understand resistivity surveys over a simulated clandestine grave. In Criminal and Environmental Soil Forensics; Ritz, K., Dawson, L., Miller, D., Eds.; Springer: Berlin/Heidelberg, Germany, 2009; pp. 271–284. [Google Scholar]
- Jervis, J.R.; Pringle, J.K. A study of the effect of seasonal climatic factors on the electrical resistivity response of three experimental graves. J. Appl. Geophys. 2014, 108, 53–60. [Google Scholar] [CrossRef]
- Rubio-Melendi, D.; Gonzalez-Quirós, A.; Roberts, D.; García, M.d.C.G.; Domínguez, A.C.; Pringle, J.K.; Fernández-Álvarez, J.-P. GPR and ERT detection and characterization of a mass burial, Spanish Civil War, Northern Spain. Forensic Sci. Int. 2018, 287, e1–e9. [Google Scholar] [CrossRef] [PubMed]
- Matias, H.C.; Santos, F.M.; Ferreira, F.R.; Machado, C.; Luzio, R. Detection of graves using the micro-resistivity method. Ann. Geophys. 2006, 49, 1235–1244. [Google Scholar] [CrossRef]
- Simyrdanis, K.; Papadopoulos, N.; Kim, J.H.; Tsourlos, P.; Moffat, I. Archaeological investigations in the shallow seawater environment with electrical resistivity tomography. Near Surf. Geophys. 2015, 13, 601–611. [Google Scholar] [CrossRef]
- Tsokas, G.; Tsourlos, P.; Vargemezis, G.; Novack, M. Non-destructive electrical resistivity tomography for indoor investigation: The case of Kapnikarea Church in Athens. Archaeol. Prospect. 2008, 15, 47–61. [Google Scholar] [CrossRef]
- Tsokas, G.; Tsourlos, P.; Vargemezis, G.; Pazaras, N.T. Using surface and cross-hole resistivity tomography in an urban environment: An example of imaging the foundations of the ancient wall in Thessaloniki, North Greece. Phys. Chem. Earth Parts A/B/C 2011, 36, 1310–1317. [Google Scholar] [CrossRef]
- Tsourlos, P.; Tsokas, G. Non-destructive electrical resistivity tomography survey at the south walls of the Acropolis of Athens. Archaeol. Prospect. 2011, 18, 173–186. [Google Scholar] [CrossRef]
- Getaneh, A.; Haile, T. Optimized electrical resistivity tomography investigation established in identifying pit tombs of Mogareb, a cemetery area in a Pre-Aksumite archaeological site of Seglamen, northern Ethiopia. Measurement 2018, 129, 558–564. [Google Scholar] [CrossRef]
- Fiedler, S.; Illich, B.; Berger, J.; Graw, M. The effectiveness of ground-penetrating radar surveys in the location of unmarked burial sites in modern cemeteries. J. Appl. Geophys. 2009, 68, 380–385. [Google Scholar] [CrossRef]
- Vaughan, C. Ground-penetrating radar surveys used in archaeological investigations. Geophysics 1986, 51, 595–604. [Google Scholar] [CrossRef]
- Ruffell, A.; Pringle, J.; Cassella, J.; Morgan, R.; Ferguson, M.; Heaton, V.; Hope, C.; McKinley, J. The use of geoscience methods for aquatic forensic searches. Earth-Sci. Rev. 2017, 171, 323–337. [Google Scholar] [CrossRef] [Green Version]
- Annan, A.; Davis, J. Impulse radar sounding in permafrost. Radio Sci. 1976, 11, 383–394. [Google Scholar] [CrossRef]
- Annan, A.; Davis, J. Impulse radar and time-domain reflectometry experiments in permafrost terrain during 1976. Geol. Surv. Can.: Rep. Act. Part B 1977, 77-1B, 67. [Google Scholar] [CrossRef]
- Haeni, F.; Buursink, M.L.; Costa, J.E.; Melcher, N.B.; Cheng, R.T.; Plant, W.J. Ground penetrating radar methods used in surface-water discharge measurements. In Proceedings of the Eighth International Conference on Ground Penetrating Radar, Gold Coast, Australia, 23–26 May 2000; pp. 494–500. [Google Scholar]
- Spicer, K.R.; Costa, J.E.; Placzek, G. Measuring flood discharge in unstable stream channels using ground-penetrating radar. Geology 1997, 25, 423–426. [Google Scholar] [CrossRef]
- Haeni, F.; McKeegan, D.K.; Capron, D.R. Ground-Penetrating Radar Study of the Thickness and Extent of Sediments Beneath Silver Lake, Berlin and Meriden, Connecticut; US Department of the Interior, Geological Survey: Connecticut, UK, 1987.
- Sellmann, P.V.; Delaney, A.J.; Arcone, S.A. Sub-Bottom Surveying in Lakes with Ground-Penetrating Radar; US Army Cold Regions Research and Engineering Laboratory: Hanover, Germany, 1992. [Google Scholar]
- Ruffell, A. Under-water scene investigation using ground penetrating radar (GPR) in the search for a sunken jet ski, Northern Ireland. Sci. Justice 2006, 46, 221–230. [Google Scholar] [CrossRef]
- Parker, R.; Ruffell, A.; Hughes, D.; Pringle, J. Geophysics and the search of freshwater bodies: A review. Sci. Justice 2010, 50, 141–149. [Google Scholar] [CrossRef]
- Forde, M.; McCann, D.; Clark, M.; Broughton, K.; Fenning, P.; Brown, A. Radar measurement of bridge scour. Ndt E Int. 1999, 32, 481–492. [Google Scholar] [CrossRef]
- Pringle, J.K.; Jervis, J.R.; Hansen, J.D.; Jones, G.M.; Cassidy, N.J.; Cassella, J.P. Geophysical Monitoring of Simulated Clandestine Graves Using Electrical and Ground-Penetrating Radar Methods: 0–3 Years After Burial. J. Forensic Sci. 2012, 57, 1467–1486. [Google Scholar] [CrossRef] [PubMed] [Green Version]
- Pringle, J.K.; Holland, C.; Szkornik, K.; Harrison, M. Establishing forensic search methodologies and geophysical surveying for the detection of clandestine graves in coastal beach environments. Forensic Sci. Int. 2012, 219, e29–e36. [Google Scholar] [CrossRef] [PubMed]
- Pringle, J.K.; Jervis, J.R.; Roberts, D.; Dick, H.C.; Wisniewski, K.D.; Cassidy, N.J.; Cassella, J.P. Long-term Geophysical Monitoring of Simulated Clandestine Graves using Electrical and Ground Penetrating Radar Methods: 4–6 Years After Burial. J. Forensic Sci. 2016, 61, 309–321. [Google Scholar] [CrossRef] [Green Version]
- Groen, W.M.; Marquez-Grant, N.; Janaway, R.C. Forensic Archaeology: A Global Perspective; John Wiley & Sons: West Sussex, UK, 2015. [Google Scholar]
- Nobes, D.C. The search for “Yvonne”: A case example of the delineation of a grave using near-surface geophysical methods. J. Forensic Sci. 2000, 45, 715–721. [Google Scholar] [CrossRef]
- Barone, P.M.; Di Maggio, R.M. Forensic geophysics: Ground penetrating radar (GPR) techniques and missing persons investigations. Forensic Sci. Res. 2019, 4, 337–340. [Google Scholar] [CrossRef] [PubMed] [Green Version]
- Billinger, M.S. Utilizing ground penetrating radar for the location of a potential human burial under concrete. Can. Soc. Forensic Sci. J. 2009, 42, 200–209. [Google Scholar] [CrossRef]
- Fernández-Álvarez, J.-P.; Rubio-Melendi, D.; Martínez-Velasco, A.; Pringle, J.K.; Aguilera, H.-D. Discovery of a mass grave from the Spanish Civil War using Ground Penetrating Radar and forensic archaeology. Forensic Sci. Int. 2016, 267, e10–e17. [Google Scholar] [CrossRef] [PubMed]
- Moffat, I. How We’re Developing Underground Mapping Technologies—Lessons from the Beaumont Case. Available online: https://theconversation.com/how-were-developing-underground-mapping-technologies-lessons-from-the-beaumont-case-90687 (accessed on 30 April 2021).
- Mallett, X. The Beaumont Children’s Disappearance—An End of Innocence. In Cold Case Investigations; Macmillan by Pan Macmillan Australia Pty Ltd.: Sydney, Australia, 2019; pp. 43–75. [Google Scholar]
- Molina, C.M.; Wisniewski, K.D.; Drake, J.; Baena, A.; Guatame, A.; Pringle, J.K. Testing Application of Geographical Information Systems, Forensic Geomorphology and Electrical Resistivity Tomography to Investigate Clandestine Grave Sites in Colombia, South America. J. Forensic Sci. 2020, 65, 266–273. [Google Scholar] [CrossRef] [PubMed] [Green Version]
- Ellwood, B.B.; Owsley, D.W.; Ellwood, S.H.; Mercado-Allinger, P.A. Search for the grave of the hanged Texas gunfighter, William Preston Longley. Hist. Archaeol. 1994, 28, 94–112. [Google Scholar] [CrossRef]
- Pringle, J.K.; Jervis, J.R. Electrical resistivity survey to search for a recent clandestine burial of a homicide victim, UK. Forensic Sci. Int. 2010, 202, e1–e7. [Google Scholar] [CrossRef]
- Christensen, A.M.; Passalacqua, N.V.; Bartelink, E.J. Forensic Anthropology: Current Methods and Practice, 2nd ed.; Academic Press: London, UK, 2019. [Google Scholar]
- Berezowski, V.; Keller, J.; Liscio, E. 3D Documentation of a Clandestine Grave: A Comparison Between Manual and 3D Digital Methods. J. Assoc. Crime Scene Reconstruction. 2018, 22, 23–37. [Google Scholar]
- Vannan, A. Forensic Archaeological Remote Sensing and Geospatial Analysis. In Multidisciplinary Approaches to Forensic Archaeology; Barone, P.M., Groen, W.M., Eds.; Soil Forensics Springer: Cham, Switzerland, 2018; pp. 19–40. [Google Scholar]
Figure 1.
Typical GPR unit in use. GSSI SIR 4000 GPR with a 400 MHz antenna.

Figure 2.
ZZ FlashRes64 ERT system being used in the field. Note the wetness around the electrodes from where they were watered to lower the contact resistance.
Figure 2.
ZZ FlashRes64 ERT system being used in the field. Note the wetness around the electrodes from where they were watered to lower the contact resistance.

Figure 3.
Geoscan Research RM85 Resistance Meter being used in the field.

Figure 4.
A comparison between GPR (top) and ERT (middle) collected over three pigs (bottom) buried at an approximate depth of one meter approximately one month prior to survey. The burial is observable in the GPR, both by the stratigraphic disturbance in the shallow subsurface and by hyperbola on the pig bodies. The burial is observable in the ERT data, both by a resistive anomaly in the shallow subsurface above the pigs, due to soil disturbance, and a conductive anomaly directly related to the pigs (white dotted rectangles).


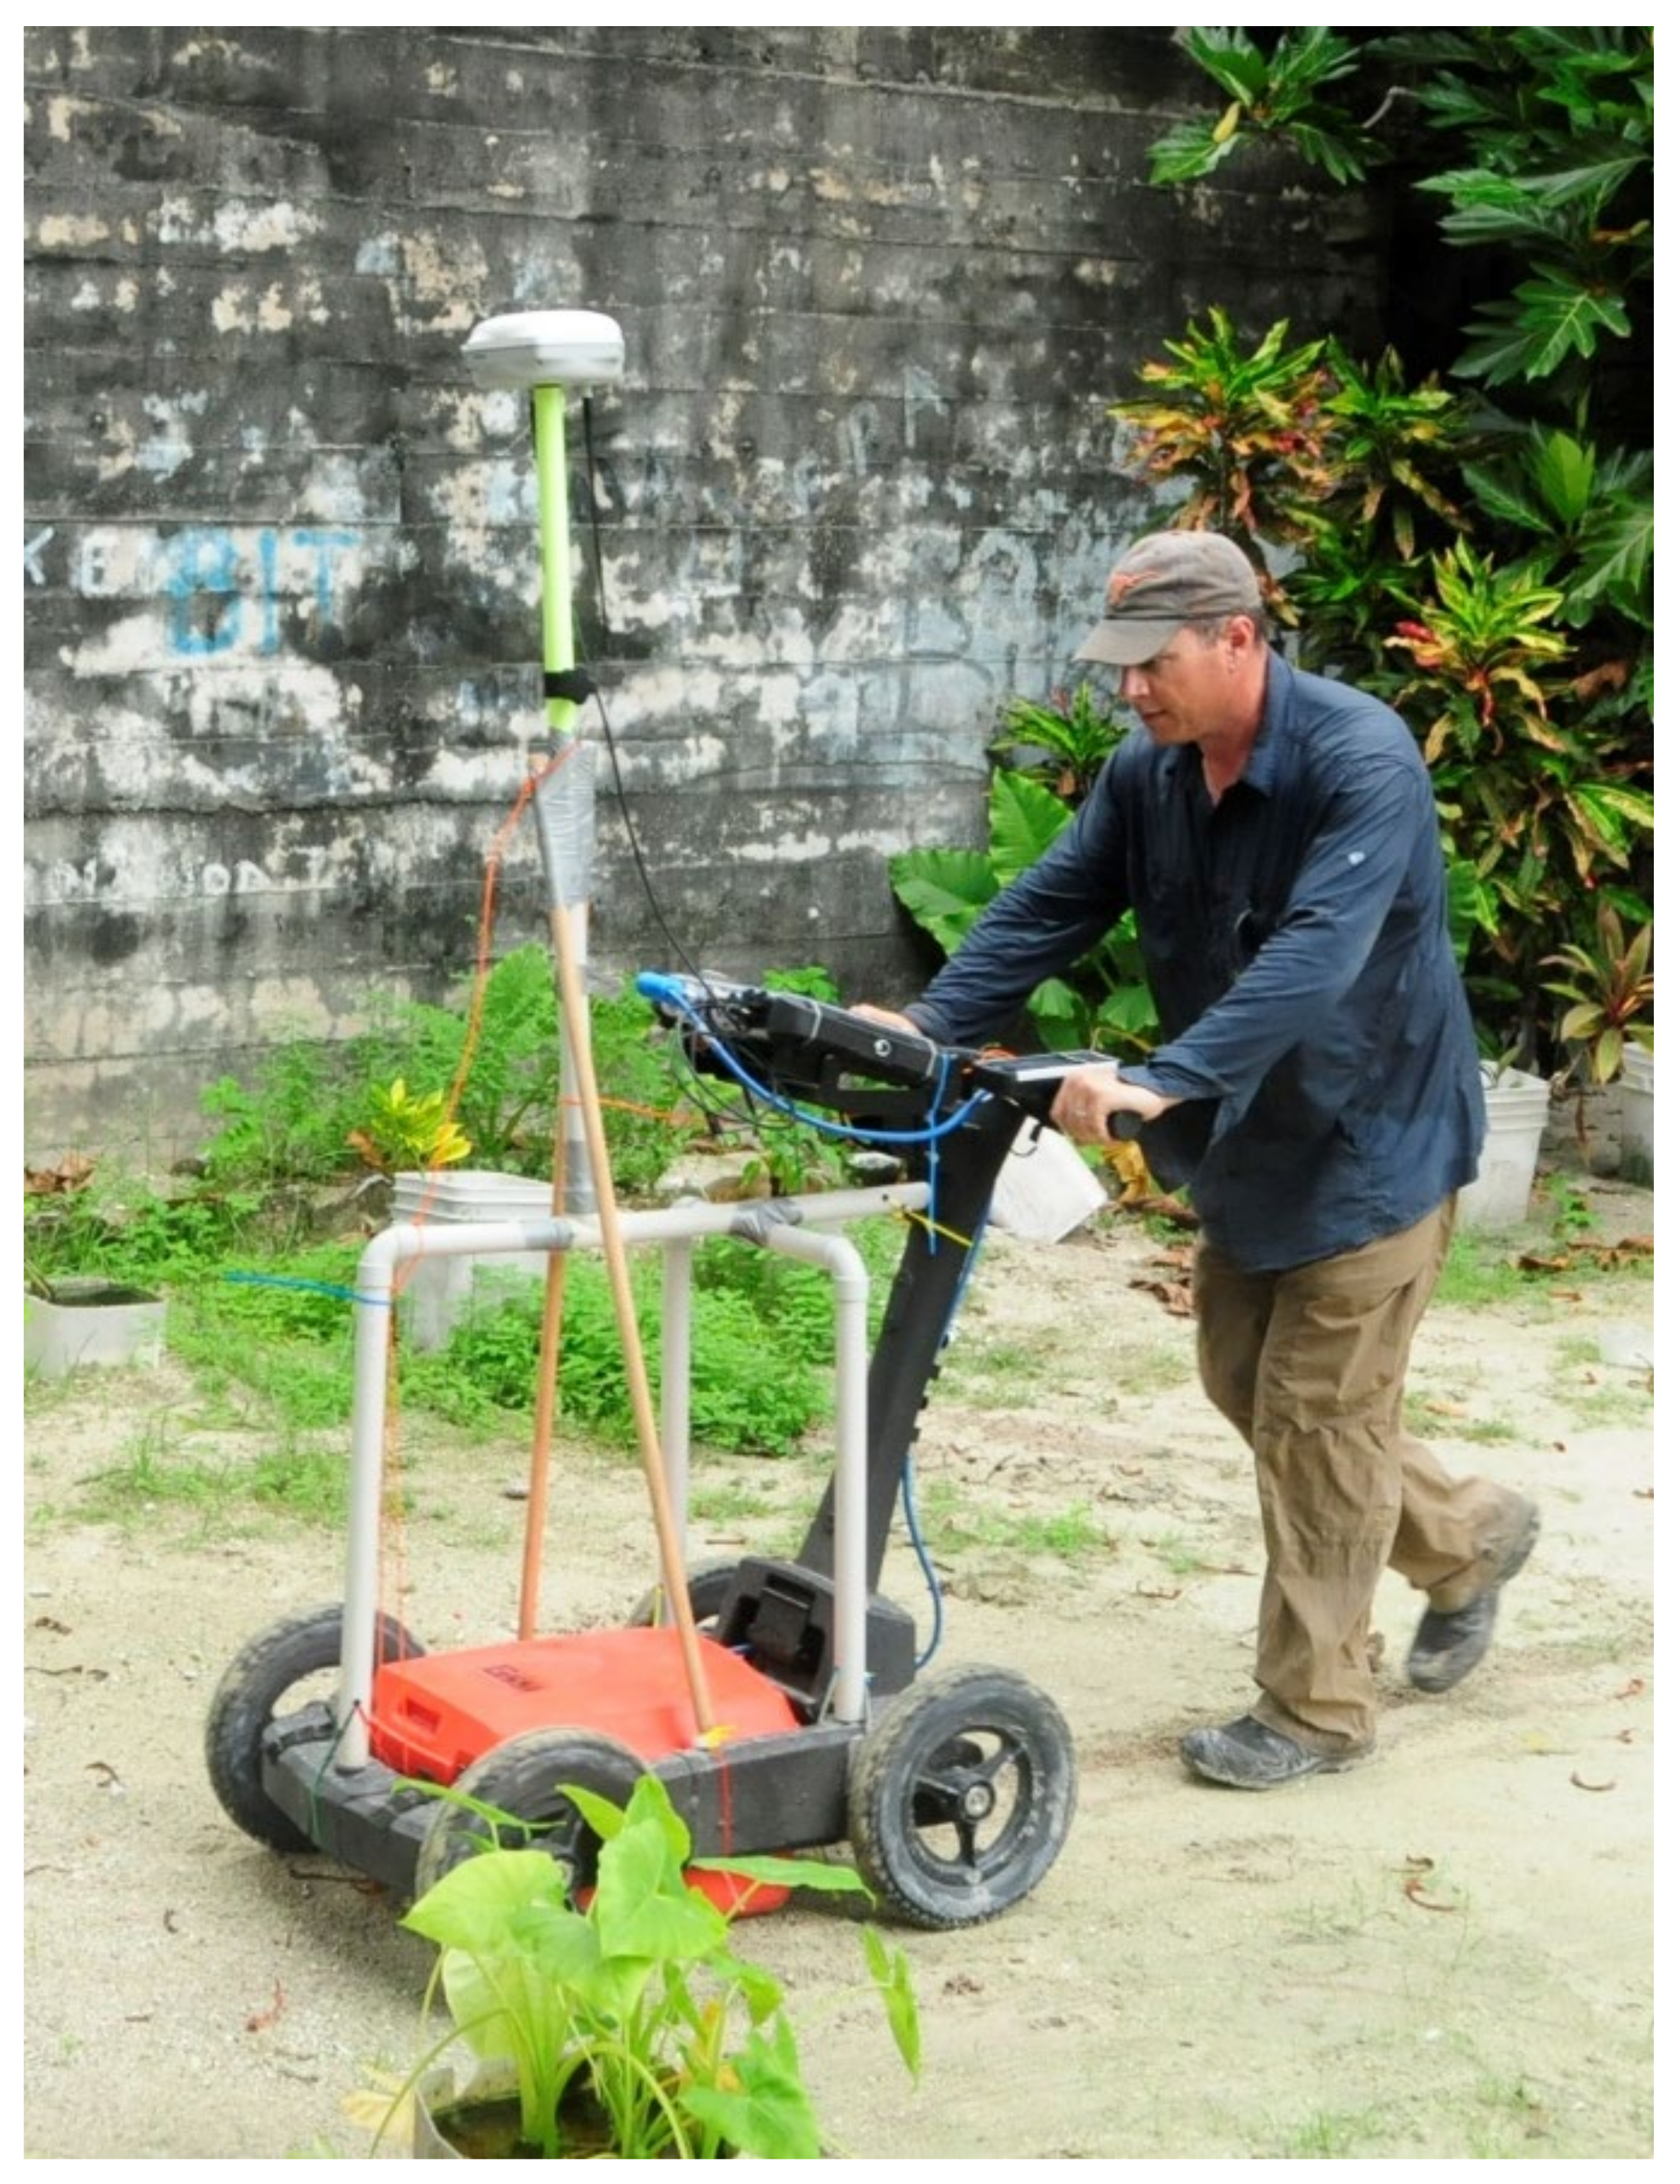
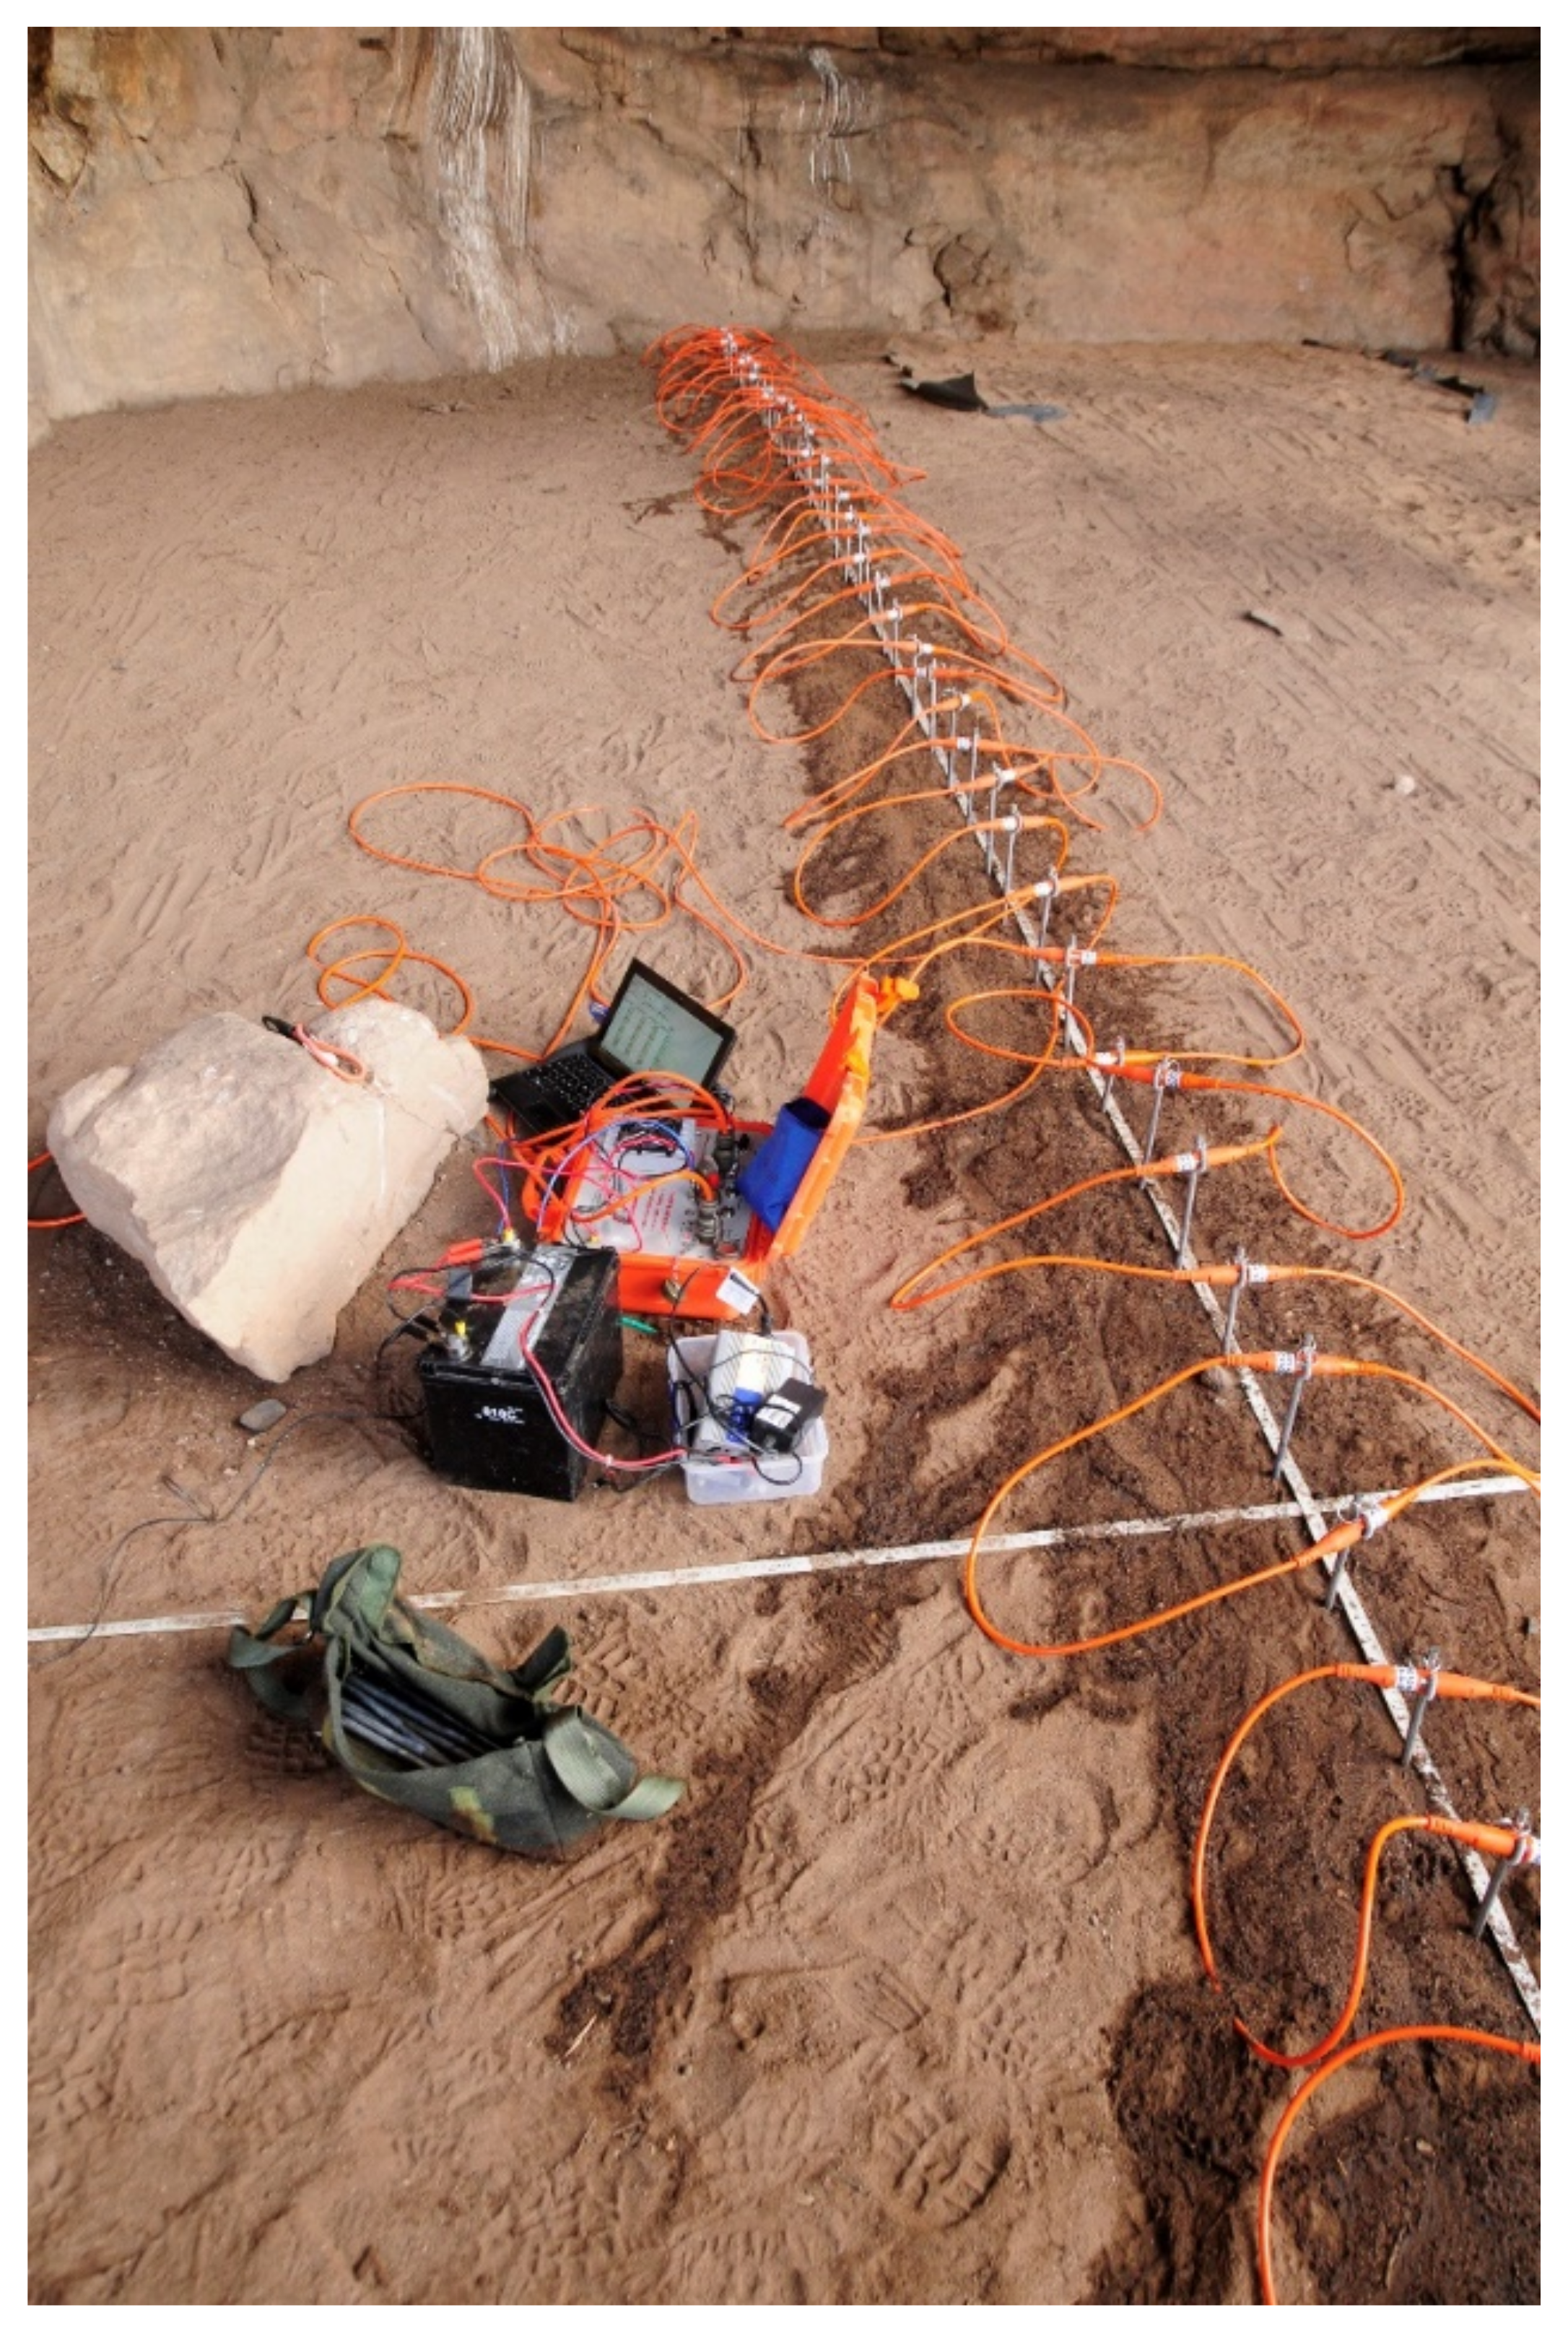
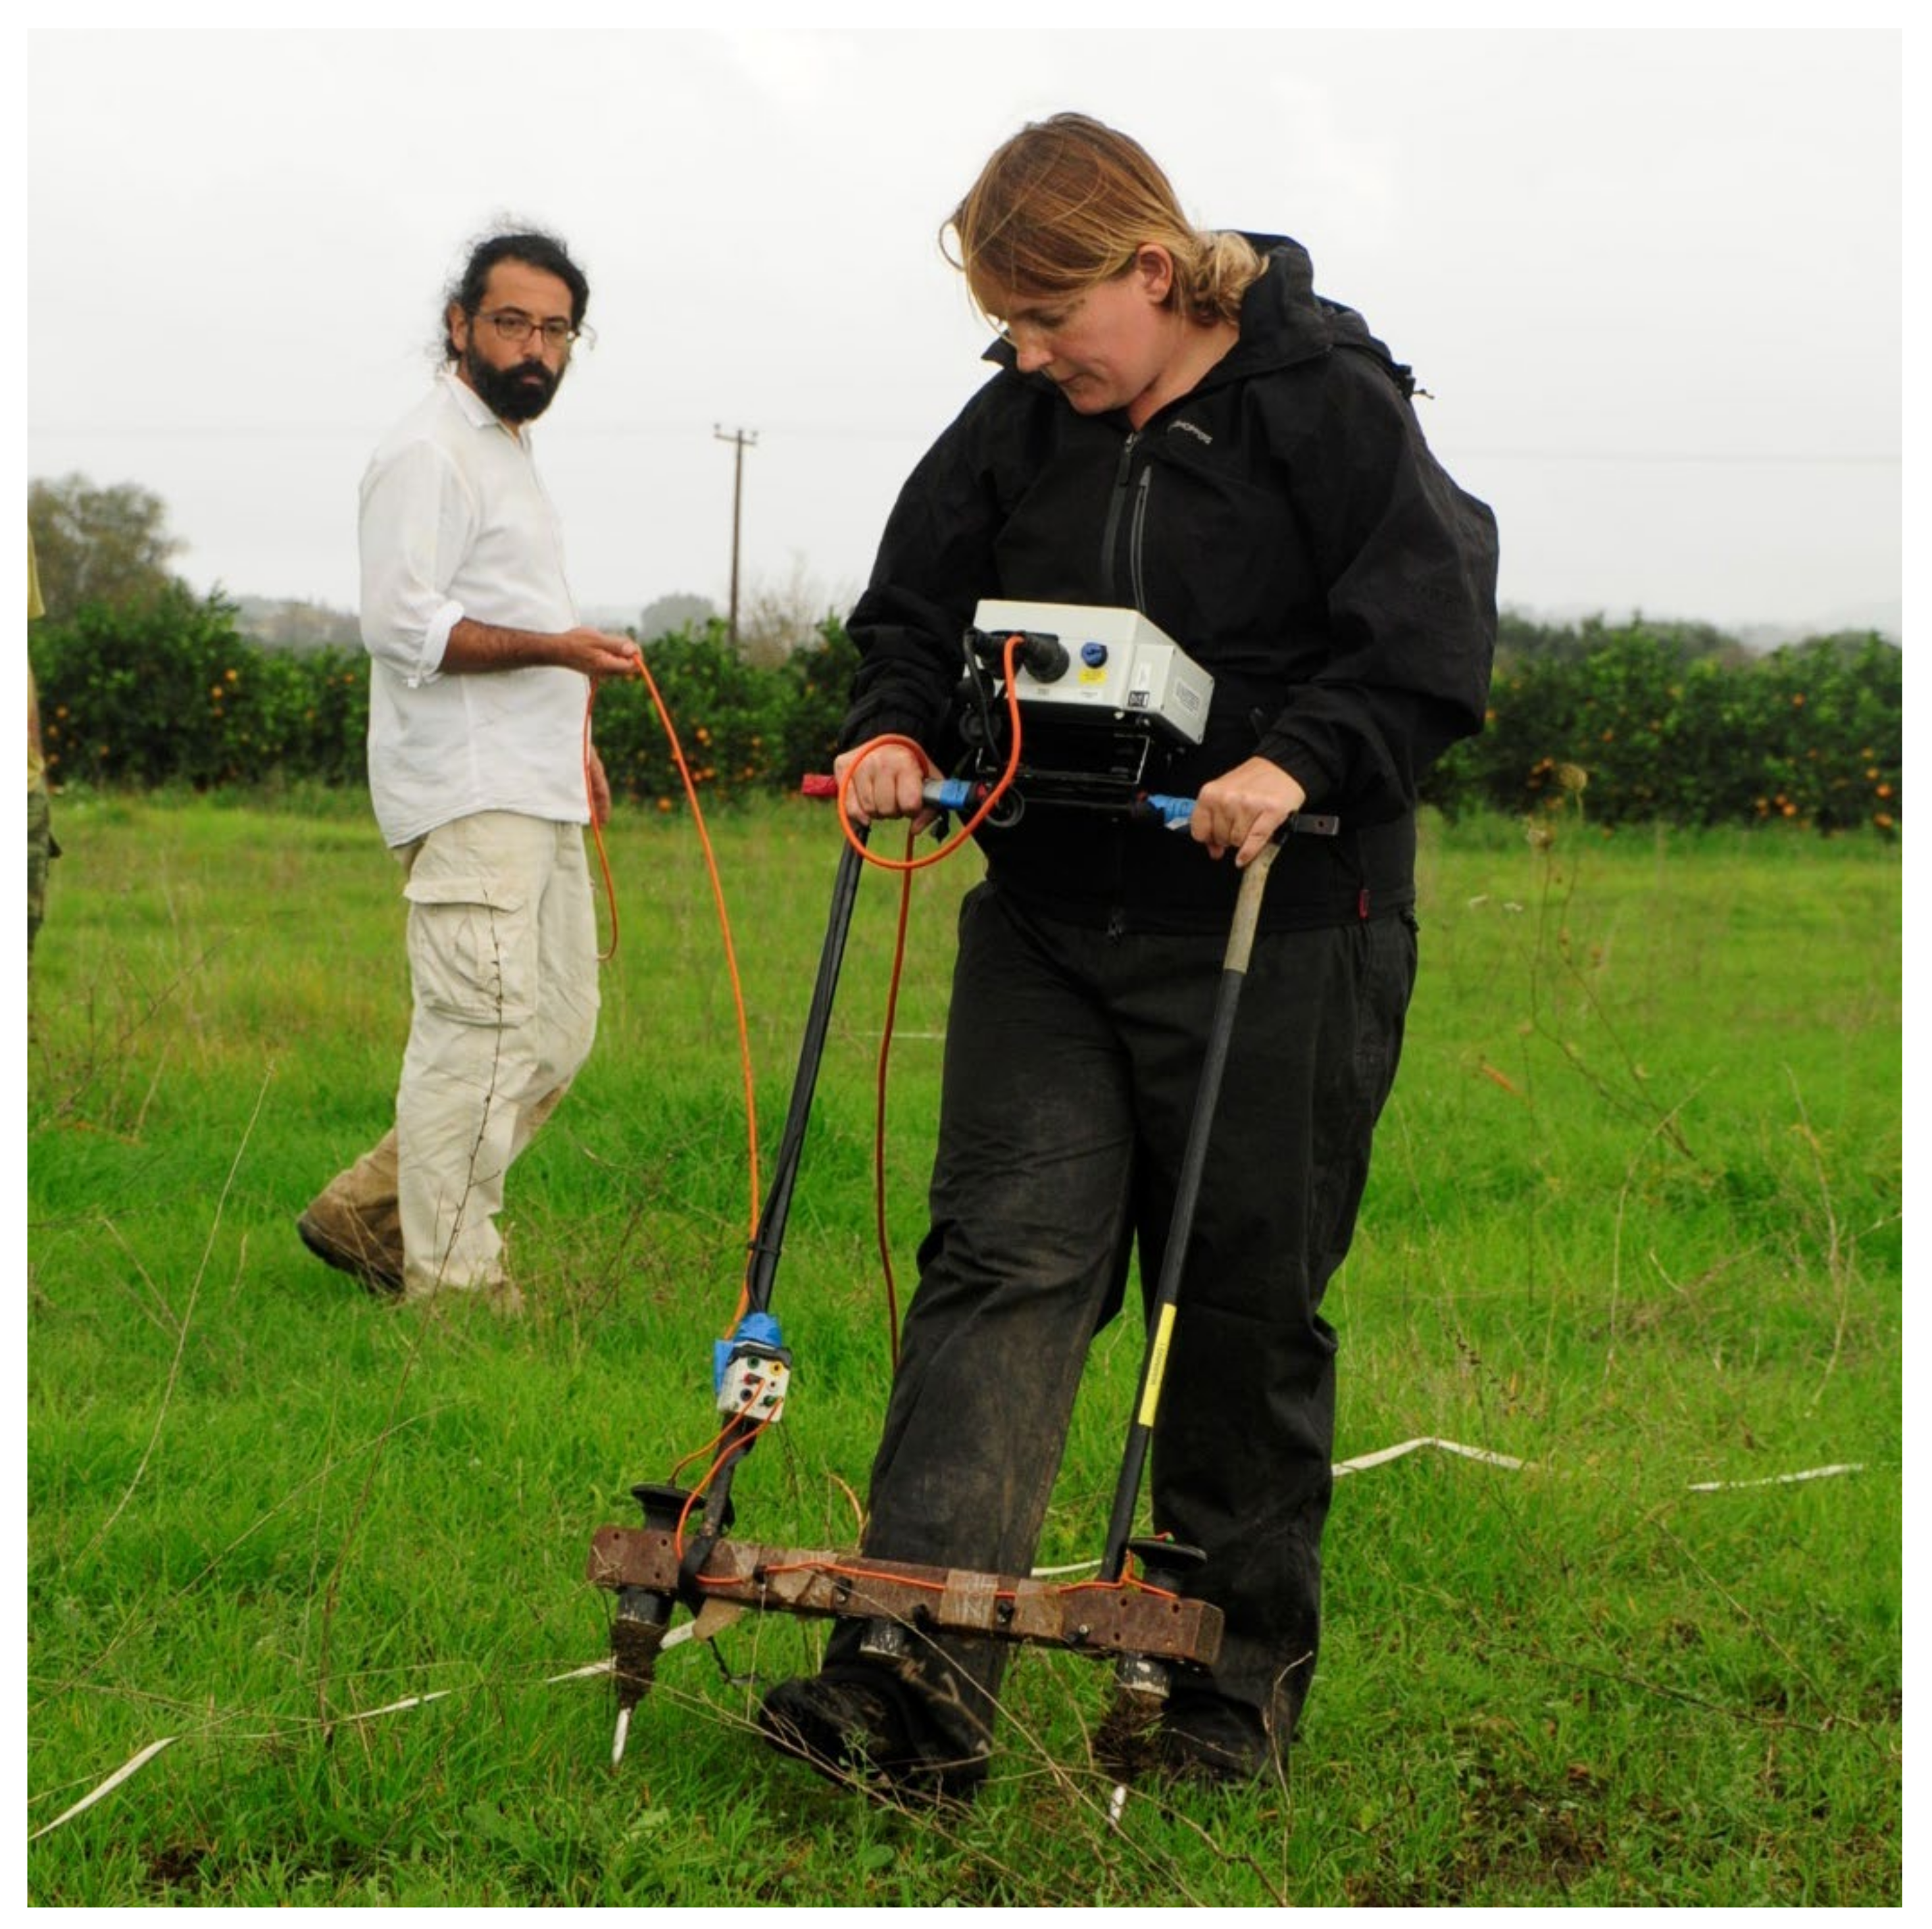
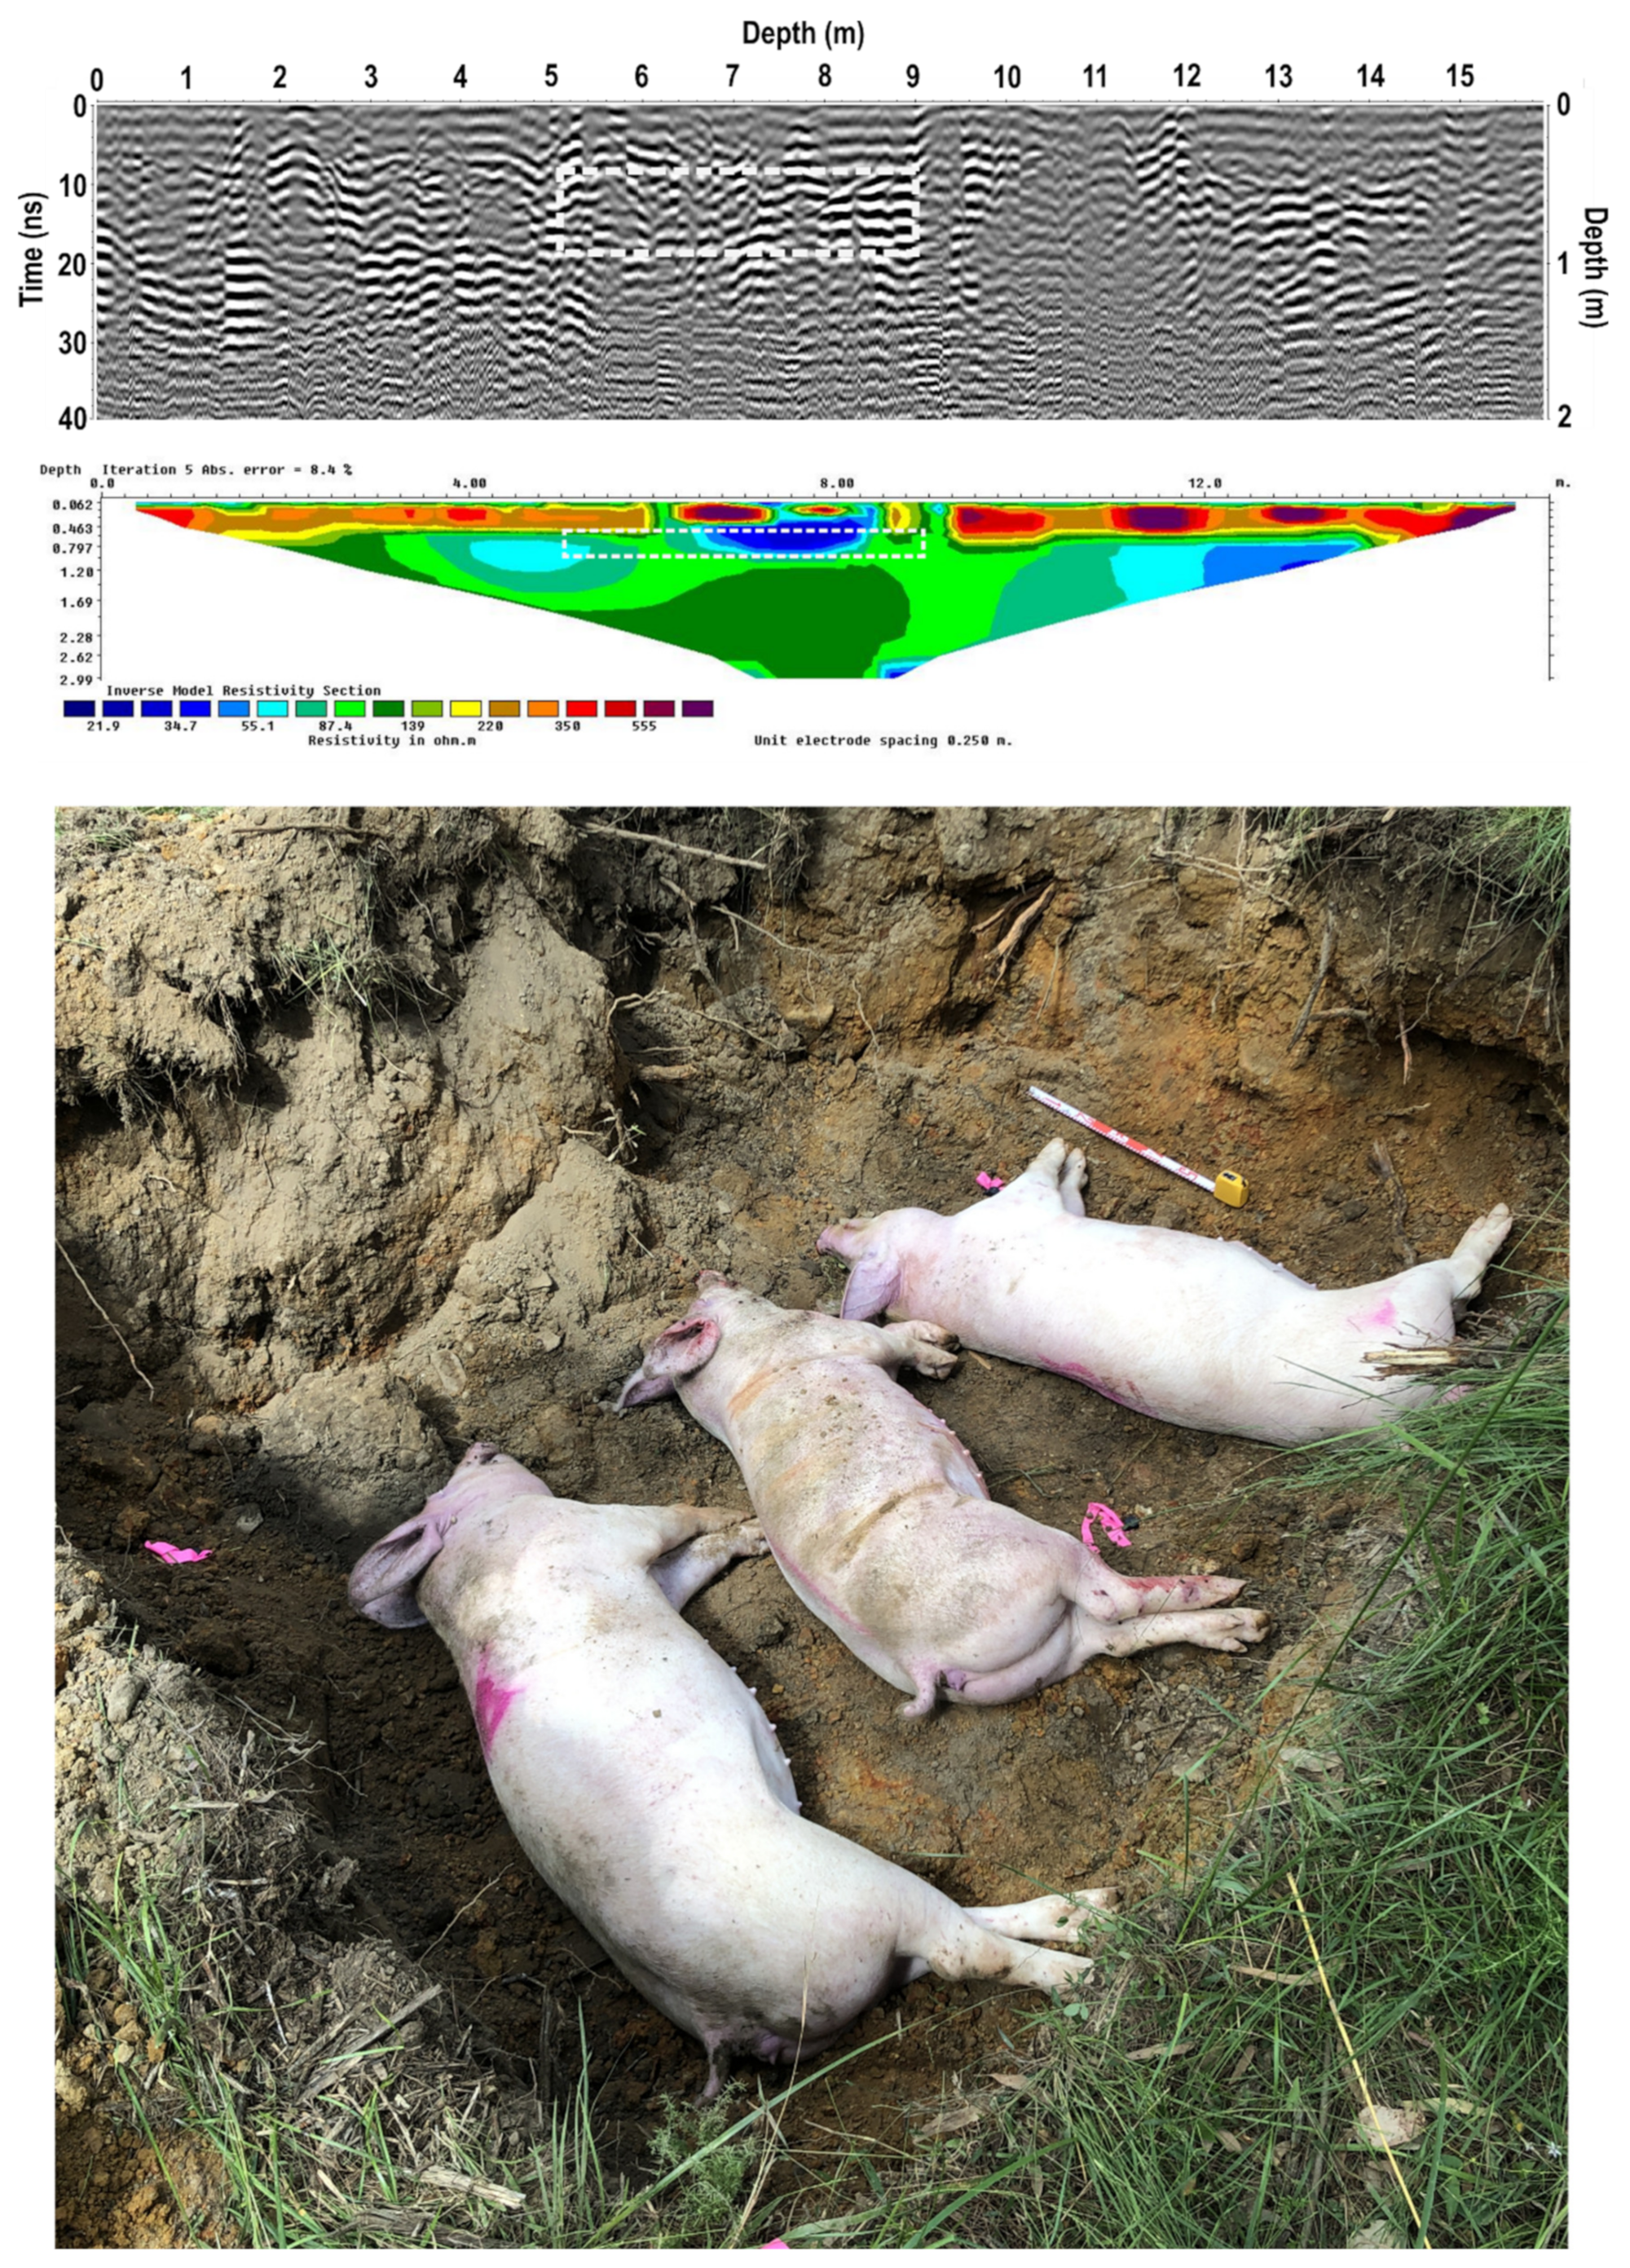
Table 1.
List of processing purposes and the approach that should be used to accomplish them for GPR data, as per Conyers [30].
Table 1.
List of processing purposes and the approach that should be used to accomplish them for GPR data, as per Conyers [30].
| Processing Purposes and Approach | |
|---|---|
| Processing Purposes | Processing Approach |
| Increase visibility of deeper features | AGC or time varying gain |
| Remove noise | Background removal, high-pass and low-pass filters, frequency filtering |
| Remove point source hyperbolas to their sources | Migration |
| Correct the orientation of steep dipping layers | |
| Change visibility of reflections of interest | Frequency filtering |
Table 2.
List of processing objectives and the method that should be used to accomplish them for FPR data [36].
Table 2.
List of processing objectives and the method that should be used to accomplish them for FPR data [36].
| Processing Purposes and Approach | |
|---|---|
| Processing Purposes | Processing Approach |
| Data improvement | |
| Even out differences between data grids | Grid balancing |
| Correct erroneous resistance measurements (from high contact resistance or impeded current flow) | Spike removal |
| Remove stripy data (due to sensor balancing imperfections) | Line adjustment |
| Data processing | |
| Retain and emphasize small features and remove background variations | High-pass filtering |
| Remove unwanted data of broad background changes and suppress variations that are smaller than the intended target | Low-pass filtering |
| Create smoother appearance with finer resolution (for noisy data) | Interpolation |
| Image processing | |
| Convert data numbers into grayscale raster images * | Transfer function |
* Converting FPR data into an image for interpretation is an irreversible process, meaning that the actual measurement data cannot be reconstructed once the pixels are calculated [36]. At this point, important information may be lost. Although this step is helpful for evaluating data, it is not a replacement for the recorded measurements [36].
Table 3.
Compiled list of the optimal and non-optimal areas in which to conduct a GPR survey as per Schultz [24].
Table 3.
Compiled list of the optimal and non-optimal areas in which to conduct a GPR survey as per Schultz [24].
| Optimal and Non-Optimal Areas to Search for Graves Using Gpr | |
|---|---|
| Optimal | Non-Optimal |
| Dry, sandy soils | Clay rich and high saline soils |
| Fresh water (see above) | Salt water (see above) |
| Flat ground | Uneven ground/hills |
| Areas void of large surface and subsurface objects (gravestones, rocks, gravel layers) | Areas with large surface and subsurface objects (gravestones, rocks, gravel layers) |
| Areas with low and sparse vegetation | Areas with tall and dense vegetations |
Table 4.
Compiled list of the optimal and non-optimal areas in which to conduct a resistivity survey as per Moffat [5] and Pringle et al. [37].
| Optimal and Non-Optimal Areas to Search for Graves Using Resistivity Methods | |
|---|---|
| Optimal | Non-Optimal |
| High saline soils | Dry soil, lacking moisture |
| Clay rich soils | After a metal detector survey |
| Areas with large surface and subsurface objects (gravestones, fences, rocks, gravel layers) | |
| Areas with tall and dense vegetation | |
Publisher’s Note: MDPI stays neutral with regard to jurisdictional claims in published maps and institutional affiliations. |
© 2021 by the authors. Licensee MDPI, Basel, Switzerland. This article is an open access article distributed under the terms and conditions of the Creative Commons Attribution (CC BY) license (https://creativecommons.org/licenses/by/4.0/).
Share and Cite
MDPI and ACS Style
Berezowski, V.; Mallett, X.; Ellis, J.; Moffat, I. Using Ground Penetrating Radar and Resistivity Methods to Locate Unmarked Graves: A Review. Remote Sens. 2021, 13, 2880. https://doi.org/10.3390/rs13152880
AMA Style
Berezowski V, Mallett X, Ellis J, Moffat I. Using Ground Penetrating Radar and Resistivity Methods to Locate Unmarked Graves: A Review. Remote Sensing. 2021; 13(15):2880. https://doi.org/10.3390/rs13152880
Chicago/Turabian StyleBerezowski, Victoria, Xanthé Mallett, Justin Ellis, and Ian Moffat. 2021. "Using Ground Penetrating Radar and Resistivity Methods to Locate Unmarked Graves: A Review" Remote Sensing 13, no. 15: 2880. https://doi.org/10.3390/rs13152880
Note that from the first issue of 2016, this journal uses article numbers instead of page numbers. See further details here.