The Great Recession, COVID-19, interest hikes left a 15-year mark on housing

A home for sale in Fairfax Station, VA by asianjournalusa licensed under Creative Commons.
How have the Great Recession in 2007, the COVID-19 pandemic that hit in 2020, and the Federal Reserve’s interest rate hikes that started in 2022 affected mortgages in the region? Here’s the short answer:
- The Great Recession pushed down the number of mortgages in the region, and then COVID-19 pushed that number back up
- The median value of mortgages also dipped during the recession and rose during COVID-19, but not as sharply as the number of mortgages
- The number of new mortgages is back to 2007 levels in exurban and suburban places, but not in urban ones
- Refinancing was happening all over the place… until the interest hikes
Each year, researchers at George Washington University use the State of the Capital Region report to do a deep dive on a policy issue in the Washington region. This year’s report focuses on mortgage markets. We’ve summarized our findings here.
With the recession came a drop in mortgages
Like the rest of the country, our region had a dramatic decline in new mortgages starting in 2007. Between 2007 and 2011, the number of mortgages extended plummeted from approximately 110,000 to 62,000, respectively. As in past economic downturns, the Washington region fared a little better than the rest of the country. Even still, lenders only furnished 90,000 home loans in 2019, which is still below the 2007 mark.
This graph’s Y axis is the number of new home mortgages relative to the 2007 number. Source: HMDA, 2007-2021, Entire US HMDA data, 2007-2019. Dietrich et al, 2018; Liu et al, 2021. 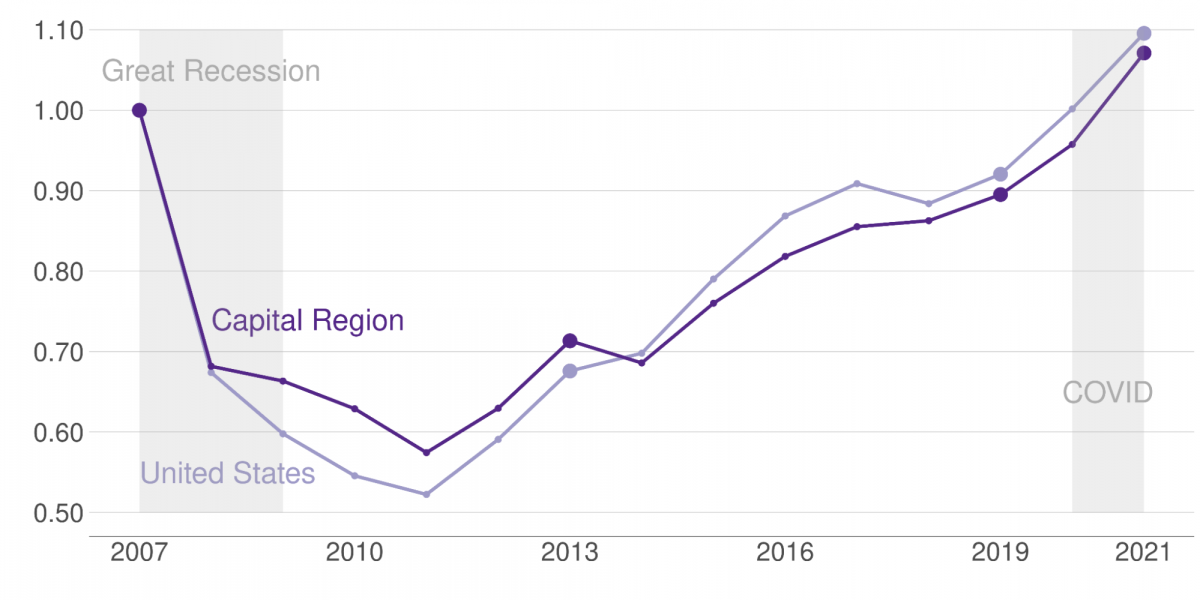
From 2014 onward, the number of new mortgages in our region grew slightly more slowly than in the rest of the country. Still, we experienced substantial growth with the onset of the pandemic and all-time low-interest rates, as the number of new home loans increased by approximately 20% from 2019 to 2021.
How many mortgages were issued in various parts of the region?
To dive further into how these overall trends played out in specific types of places, the State of the Capitol Region report divides the region into three areas: urban, suburban, and exurban. The graphic below shows which places were sorted into which category:
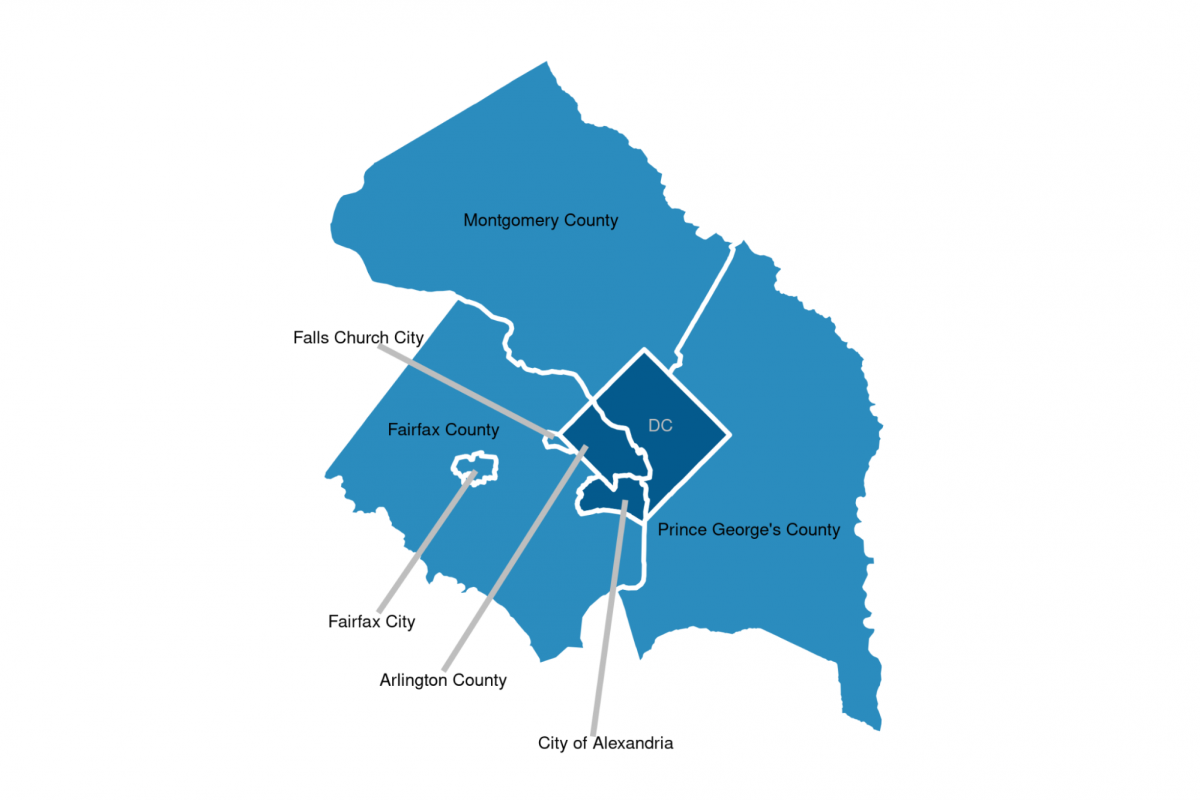
Urban, suburban and exurban areas in the Washington region. Dark blue indicates urban areas; light blue indicates suburban areas; green indicates exurban areas. Source: Census Bureau, 2010 jurisdictional boundaries. 
As mentioned above, the number of new home mortgages in the region grew substantially during the pandemic.
This was true in all types of areas, but our region’s exurban areas saw both the greatest fall and the greatest increase in new mortgages over the entire 2007-2021 period. New home mortgage issuance in exurban areas surpassed 2007 levels in 2019, and there was a 22 % increase in new mortgages between 2019 and 2021. This is somewhat unsurprising because these areas are home to most of the new housing that’s been built in the area.
In the region’s urban areas, which the report defines as Arlington, Alexandria, and the District of Columbia, each year between 2008 and 2019 saw fewer new mortgages than the number issued in 2007. One explanation for this could be that a greater proportion of housing in these places tends to be rental rather than owner-occupied.
This graph’s Y axis is the total new number of home mortgages in the region. Source: HMDA, 2007-2021 
Median loan values fell during the Great Recession and rose during the pandemic
Beyond changes in the number of mortgage loans issued from 2007-2021, there were also changes in the median value of these loans. However, as the graph below shows, these changes were much more muted. In the wake of the Great Recession, for example, the median value of mortgages only declined about 8% from about $380,000 to roughly $350,000. This decline also only occurred in suburban and exurban areas, and it was followed by a gradual increase from 2011 to 2019.
This graph’s Y axis shows the median value of home loans given. That number grew the most in urban areas, but overall values didn’t vary nearly as much as volume. Source: HMDA, 2007-2021 
Gains were largest in urban areas from 2011 to 2019, consistent with the increased demand to live in central cities of the last two decades.
The value of home mortgages shot up in all areas starting in 2019. During the pandemic, values in exurban and urban areas rose by almost 10%, while urban jurisdictions saw the median loan value jump by 6%.
The fact that loan values failed to fall, even as the number of loans took a deep dive, highlights the region’s affordability concerns.
Changes in interest rates have turned refinancing into a rollercoaster ride
Part of what made mortgages so plentiful – and house prices so high – during the last decade were interest rates that were very low by historical standards. As the Federal Reserve cut interest rates to fend off a recession during the wave of early COVID-19 job loss, the number of refinances exploded. In 2020, at their peak, the number of mortgage refinancings was more than twice the number of new home mortgages.
But rising inflation in 2021 caused the Federal Reserve to raise interest rates, taking the air out of the refinance and mortgage market. At the beginning of 2023, homeowners refinanced fewer mortgages than in any of the past five years. National data indicate that these higher interest rates have decreased the number of home loans originated overall.
What lies ahead?
What can we expect given the information contained in the State of the Capitol Region report? Here’s some of what we think the future holds.
First, it is clear that mortgages won’t get back to historic high levels and that refinancings are likely to stay at historic lows until interest rates fall. Also, since home values have remained strong a wave of mortgage defaults is unlikely. This is because as long as owners are employed, they can afford mortgage payments, and since their home values aren’t falling below the purchase price, they have an incentive to keep paying.
What does seem likely is that the Washington region, like most of the US, will struggle with too many homeowners who don’t want to leave their current residence. Many current owners have refinanced their mortgages to record-low interest rates, meaning that any move will include a higher interest rate loan. This may decrease the supply of houses available for sale, and will likely decrease regional mobility.
That’s costly to everyone because when fewer existing houses come onto the market, prices go up. It also leaves fewer homeowners with the ability to move up or down the value or size ladder. Decreased regional mobility may also mean that workers commute farther, or choose not to apply for better jobs because the case for moving is harder to justify.